
NEW YORK, August 6, 2026, 16:09 EDT — U.S. cash markets have ended trading for the day.
- The S&P 500 rose by 1.0% last week and climbed an additional 3.0% as of Thursday.
- An early assessment of the Buffett Indicator stands at 232%, while a corresponding figure from the Federal Reserve comes in at 250%.
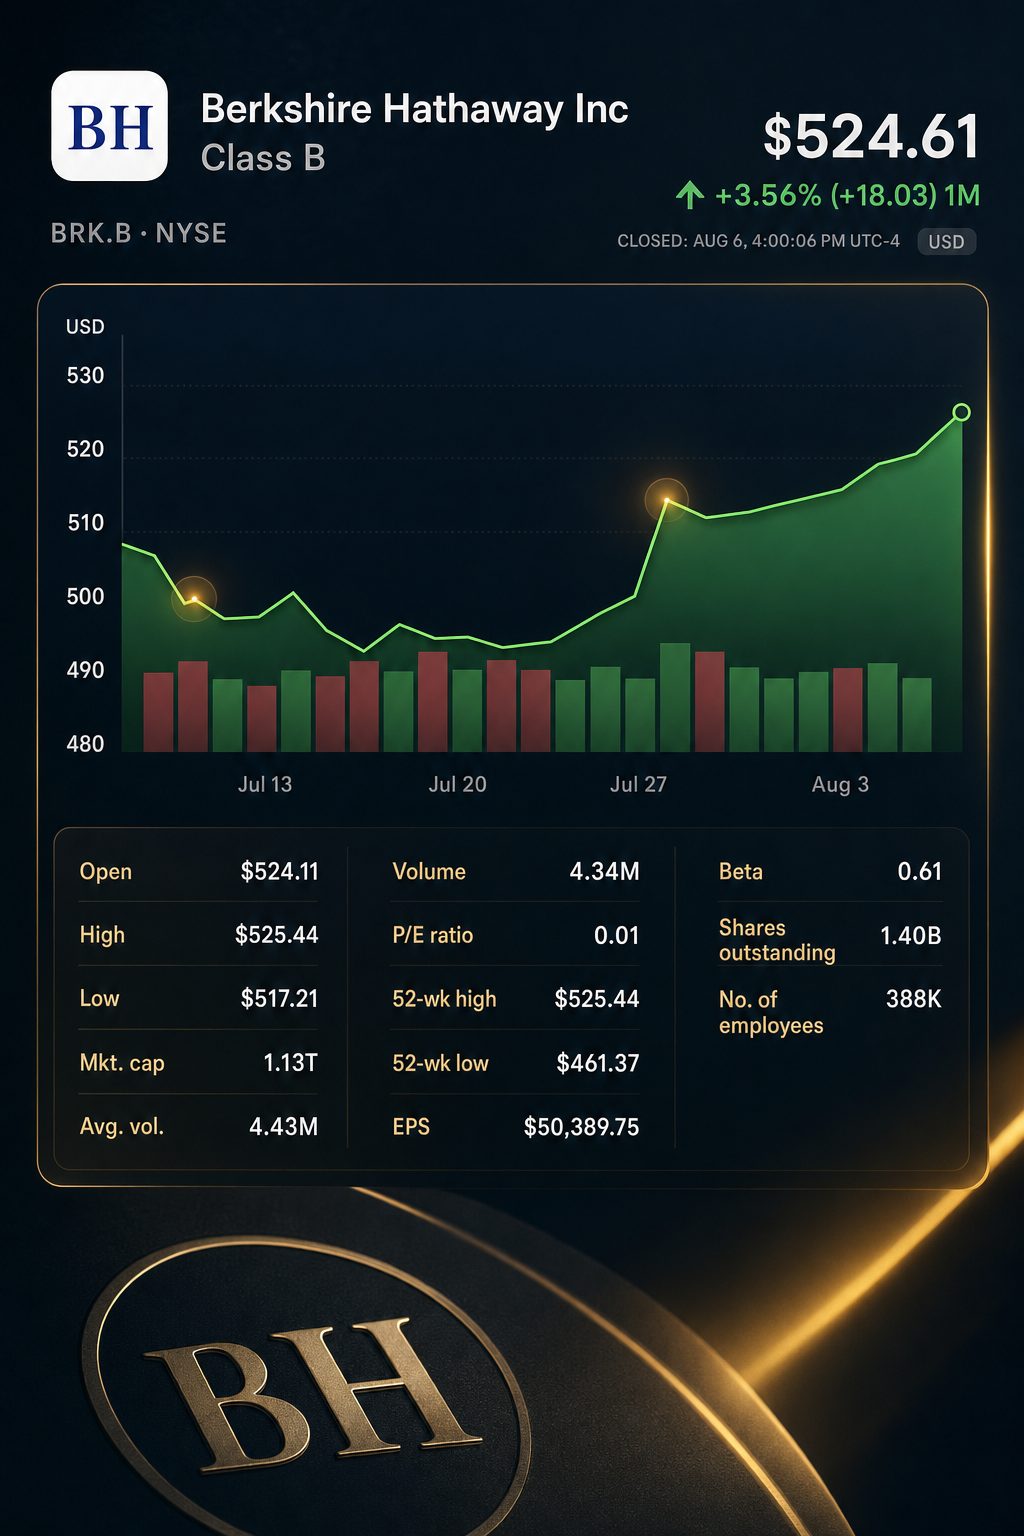
- Berkshire Hathaway NYSE:BRK.B is set to report on Saturday. Share repurchases are expected to offer the most direct insight into valuation.
U.S. stocks finished just below record highs on Thursday, even as broad valuation measures indicated caution. A clearer indication could come Saturday from Berkshire’s decisions on capital allocation.
The linked reports reference a market-cap-to-GDP ratio of around 232%. Matching figures from the Federal Reserve for March indicate a 250% ratio. This 18-point difference is significant, highlighting that the ratio’s sensitivity to methodology makes it unreliable for exact market timing.
Buffett used simpler terms. “We’ve never had more people in a gambling mood than now,” he remarked in May. He cautioned that several prices might later seem “awfully silly.” Reuters
The latest tape displayed no widespread pullback.
| Period | S&P 500 move | Ending level |
|---|---|---|
| Week ending July 31 | up 1.0% | 7,489.72 Investing.com |
| August 3–6 | up 3.0% | 7,718.05 Investing.com |
| Thursday session | down 0.07% | 7,718.05 Reuters |
| Thursday, other benchmarks | Dow down 0.71% | Nasdaq up 0.04% Reuters |
Part of the market’s resilience comes from rising profits. S&P 500 companies are on pace for a 31.1% year-over-year earnings gain in the second quarter. Growth was anticipated in ten of the index’s eleven sectors.
The forward P/E was 20.4, a decline from 22.2 at the end of the year. This level remains elevated, but the metric does not indicate a new surge in valuations.
The key indicators remain well above their long-term reference levels.
| Valuation gauge | Latest reading | Comparison |
|---|---|---|
| Live Buffett indicator | 232% — preliminary | The estimate in the link shows a new high; around 200% marked the alert range The Motley Fool |
| Fed-data analog | 250.0% | Calculated by the author from $79.674 trillion in Q1 public equities and $31.866 trillion Q1 GDP FRED |
| Shiller CAPE | 42.19 | The long-run average is 17.40; the top on record is 44.19 Multpl |
| S&P 500 forward P/E | 20.4 | Softer from 22.2 at 2025 year-end Reuters |
These metrics address distinct questions and rely on varying dates and equity scopes. Both point to a similar conclusion: higher valuations present an obstacle for future returns.
Spencer Jakab of The Wall Street Journal arrived at the same result. The indicator suggests investors should anticipate reduced long-term returns rather than prompting them to quickly leave the market.
Berkshire’s results present a clearer benchmark. Operating earnings for the first quarter climbed 17.7% to $11.35 billion. Cash holdings stood at $380.2 billion, with share buybacks amounting to only $234 million.
The repurchases amounted to roughly 0.06% of the available cash reserves, indicating limited urgency given the prices at that time. The second-quarter buyback update, due on Saturday, will provide a fresh assessment of this spending decision.
In May, Chief Executive Greg Abel stated, “We can create long-term value for shareholders.” The soon-to-be-released filing will provide an initial indication of whether that commitment is reflected in capital-allocation decisions. Berkshire plans to announce earnings and its 10-Q at approximately 7 a.m. Central time. Reuters
External analysts see limited overall upside. Among four analysts surveyed by S&P Global NYSE:SPGI, the consensus rating is Buy. Their average price target stands at $525.33.
| Recommendation measure | Analyst or firm | Stance | Price target |
|---|---|---|---|
| Top price target | Brian Meredith, UBS Group NYSE:UBS | Buy | $585 |
| Buy rating, target not specified | Kevin Heal, Argus Research | Buy | — |
| Published Hold | Edmond Fok, DBS Group SGX:D05 | Hold | $500 |
| Ratings breakdown for July | Four analysts | 2 Strong Buy; 2 Hold | $481–$585 range |
| Analyst consensus | Four analysts | Buy | $525.33 average |
The sample size is small. The average target stands just 36 cents above Thursday’s $524.97 closing price. As a result, the Buy rating reflects under 0.1% total price upside.
The upcoming eight days will bring a number of tests for high valuations.
| Date and time | Release | Main investor test |
|---|---|---|
| Friday, August 7, 08:30 EDT | July employment report | Labor market health, interest rate movement and bond yield changes Reuters |
| Saturday, August 8, about 08:00 EDT | Berkshire second-quarter results and 10-Q | Levels of buybacks, cash position and operating results Berkshire Hathaway |
| Wednesday, August 12, 08:30 EDT | July consumer prices | Inflationary trends and impact on stock discount rates Bureau of Labor Statistics |
| Thursday, August 13, 08:30 EDT | July producer prices | Changes in input costs and the effect on profit margins Bureau of Labor Statistics |
| Friday, August 14, 08:30 EDT | July retail sales | Consumer spending pace and signs of economic durability Census.gov |
Payroll numbers may influence the discount rate ahead of Berkshire’s results. Strong data could push yields higher and weigh on high-priced stocks, while a weak reading might have the opposite effect.
Risks: These valuation measures do not indicate when a reversal might occur. Stronger profit gains or declining yields may keep prices elevated. Geopolitical disruptions could also outweigh these indicators.
Buffett’s caution highlights the need for price discipline rather than suggesting a total withdrawal. The indicator serves to outline the risk. Berkshire’s choice on buybacks could indicate where potential opportunities still exist.
Related articles: NYSE:BRK-B



![Australia Stock Market Today 26/08/2026 [UPDATE: 14:42 AEST] [ASX Stabilises Near Session Low as CPI Hike Risk Lingers]](https://ts2.tech/wp-content/uploads/2026/08/AU-market-dashboard-2026-08-26-1442-480x384.jpg "Australia Stock Market Today 26/08/2026 [UPDATE: 14:42 AEST] [ASX Stabilises Near Session Low as CPI Hike Risk Lingers]")


![Australia Stock Market Today 27/08/2026 [UPDATE: 11:47 AEST] [Capex Slump Deepens ASX Losses as Equipment Spending Slides]](https://ts2.tech/wp-content/uploads/2026/08/AU-market-dashboard-2026-08-27-1145-480x384.jpg "Australia Stock Market Today 27/08/2026 [UPDATE: 11:47 AEST] [Capex Slump Deepens ASX Losses as Equipment Spending Slides]")