
OMAHA, August 23, 2026, 05:48 CDT
- Berkshire’s Class B shares finished Friday at $495.82, falling 1.63% across the past five sessions.
- The current price stands just 1.83% higher than Berkshire’s average first-quarter buyback price of $486.92.
- Operating profit increased by 16% in the second quarter, while cash declined to $364.7 billion amid faster capital deployment.
- Analyst price targets range from $481 to $604, reflecting a significant divide on valuation during the Abel era.
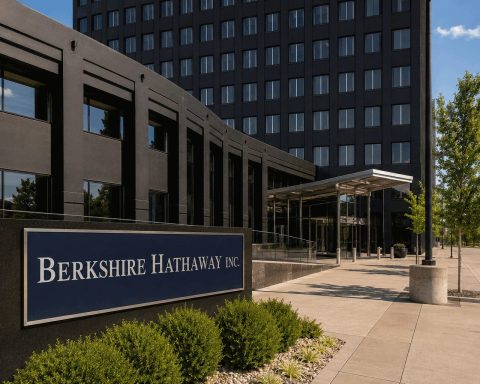
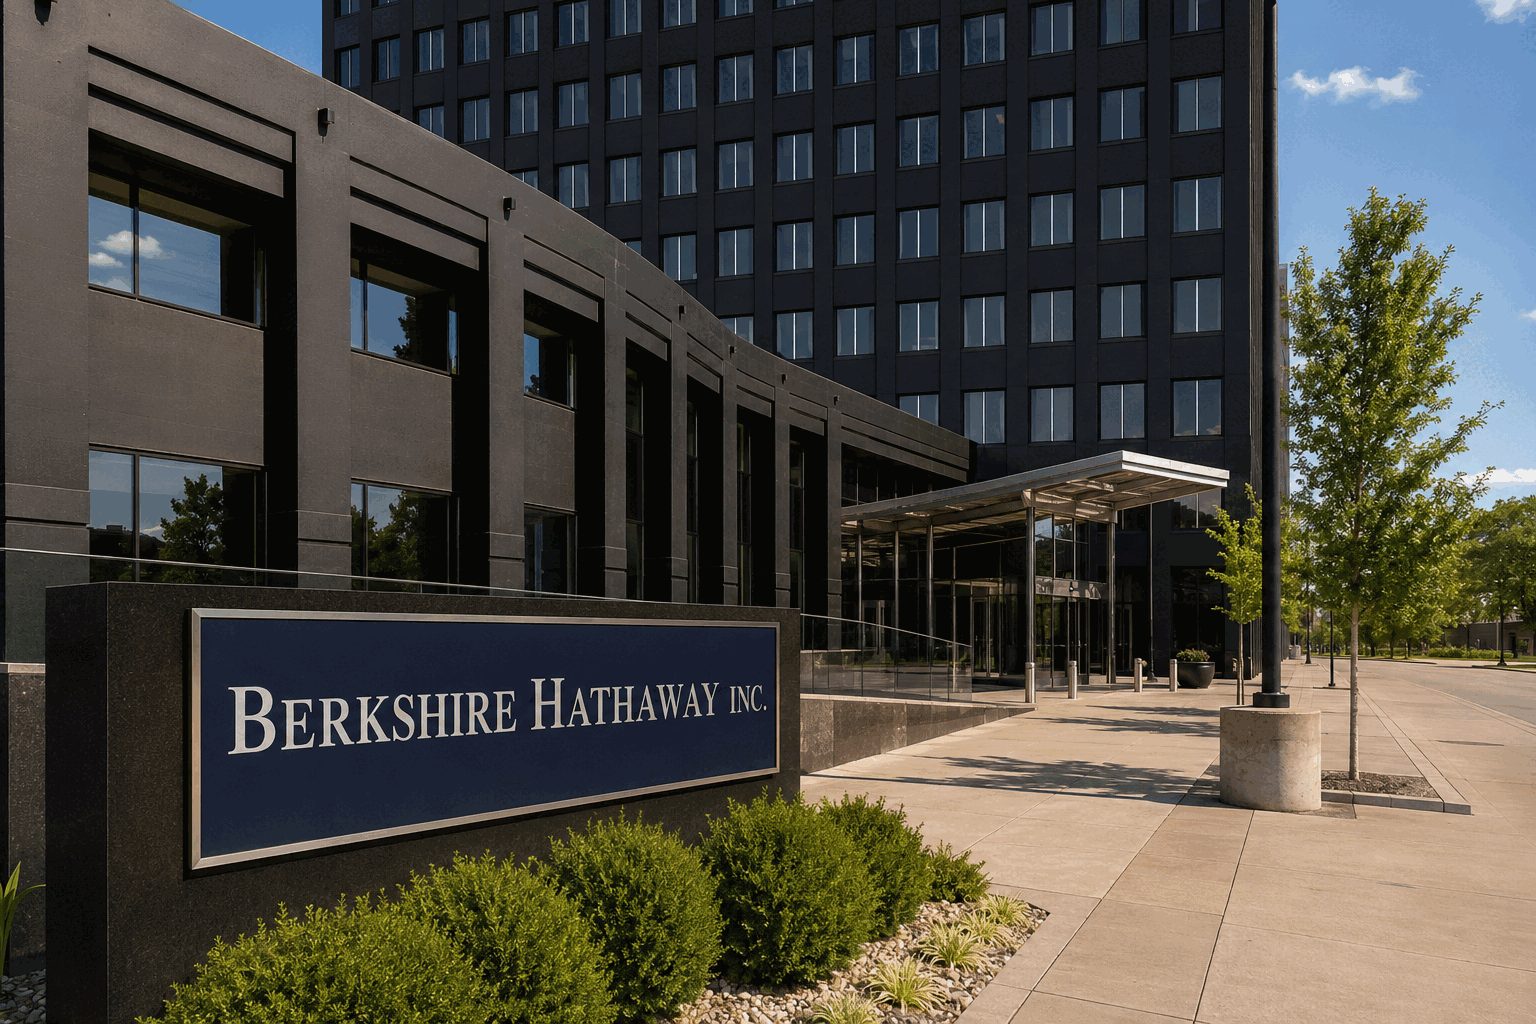
Berkshire Hathaway Inc. NYSE:BRK.B closed the week at $495.82, down 1.63% across five sessions, despite a market rebound on Friday. Shares are currently trading 1.83% above the company’s average first-quarter buyback price of $486.92.
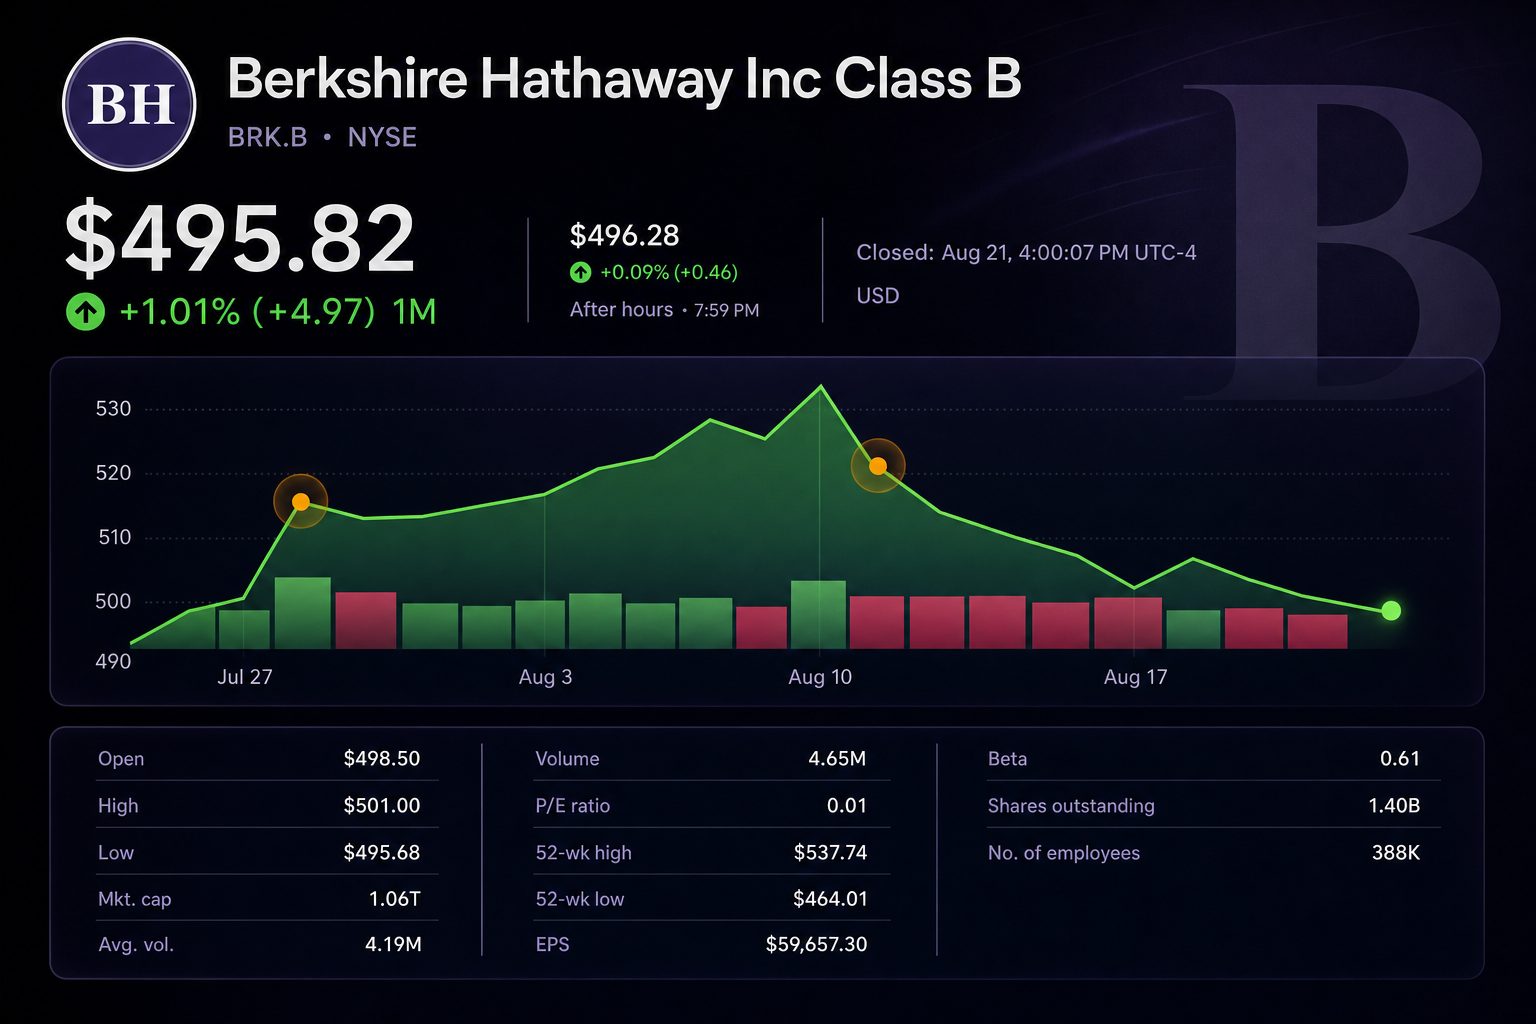
The small difference is significant. Chief Executive Greg Abel resumed buybacks in March and then quickly increased the pace. With Friday’s closing price, the shares have moved closer to levels where management previously considered its stock appealing.
The signal does not constitute an official floor. Berkshire’s guidelines permit buybacks solely if the CEO, following discussions with Chairman Warren Buffett, determines that the share price falls beneath a conservatively assessed intrinsic value. Repurchases may be halted at any time and without prior announcement.
| Date | BRK.B close | Daily move |
|---|---|---|
| Aug. 17 | $498.23 | down 1.15% |
| Aug. 18 | $502.96 | up 0.95% |
| Aug. 19 | $499.62 | down 0.66% |
| Aug. 20 | $496.86 | down 0.55% |
| Aug. 21 | $495.82 | down 0.21% |
Friday underscored the comparative underperformance. BRK.B dropped 0.21%, as the S&P 500 advanced 0.43% and the Dow climbed 0.98%. Despite this, the S&P recorded its first weekly decline since July.
The drop has led to a lower valuation. Berkshire was trading at 1.43 times book value on Friday, under its 12-month average of 1.47. Its trailing price-to-earnings ratio stood at 12.46, a measure affected by investment gains that make it particularly volatile.
| Capital and valuation marker | Latest verified figure | Investor read-through |
|---|---|---|
| Friday closing price | $495.82 | 1.83% higher than Q1 repurchase level |
| Average BRK.B buyback price in Q1 | $486.92 | Most recent disclosed reference value |
| Price-to-book ratio | 1.43× | Lower than 1.47× 12-month average |
| Q2 share repurchases | $4.5 billion | Biggest pick-up during Abel’s tenure |
| Buybacks in July | $3.3 billion | Repurchases maintained post-quarter |
| Cash and Treasury holdings as of June 30 | $364.7 billion | Remain sizable even with spending |
The business environment remains robust, despite what the share chart indicates. Operating profit for the second quarter climbed 16% to $12.98 billion. Revenue was up 10%, reaching $101.81 billion. Net income more than doubled, supported by investment gains.
| Q2 measure | Result | Year-on-year change |
|---|---|---|
| Operating profit | $12.98 billion | Up 16% |
| Revenue | $101.81 billion | Up 10% |
| Net income | $25.67 billion | Over double |
| GEICO profit | Not broken out here | Down 45% |
| Other stock purchases | $23.5 billion | First net buying in 14 quarters |
Capital allocation remains the key offset. In the second quarter, Berkshire acquired $23.5 billion in equities and divested $3.7 billion. Alphabet Inc. NASDAQ:GOOGL became Berkshire’s third-largest stock investment, valued at roughly $37.8 billion as of June 30.
Abel has set out the task directly. “Our role is stewardship,” he stated in his initial letter to shareholders. Recent repurchases make this assertion quantifiable: each dollar used to buy back shares at the prevailing price increases ongoing shareholders’ ownership in Berkshire’s assets. Quoted in Yahoo Finance
| Recommendation source | Rating | 12-month target | Implied move from $495.82 |
|---|---|---|---|
| UBS / Brian Meredith | Buy | $604 | +21.8% |
| S&P Global poll, 4 analysts | Buy | $547.67 average | +10.5% |
| MarketBeat, 3 analysts | Hold: 1 Buy, 2 Hold | $542.50 average | +9.4% |
Analyst opinions differ widely. UBS argues that the non-insurance divisions justify a higher valuation. Others remain cautious, highlighting GEICO’s declining profits, risks in capital deployment, and uncertainty surrounding the post-Buffett era.
In the coming week, investors will monitor if shares hold in the $487 to $496 range. A persistent move below the Q1 repurchase average could intensify scrutiny of ongoing buyback actions. Recovering above $503 would regain Tuesday’s closing level.
Risks: Buyback prices offer no assurance of support. Catastrophe losses, reduced short-term rates, fluctuations in rail volumes, and equity-market volatility can swiftly impact Berkshire’s earnings and estimates of intrinsic value.
Related articles: NYSE:BRK-B