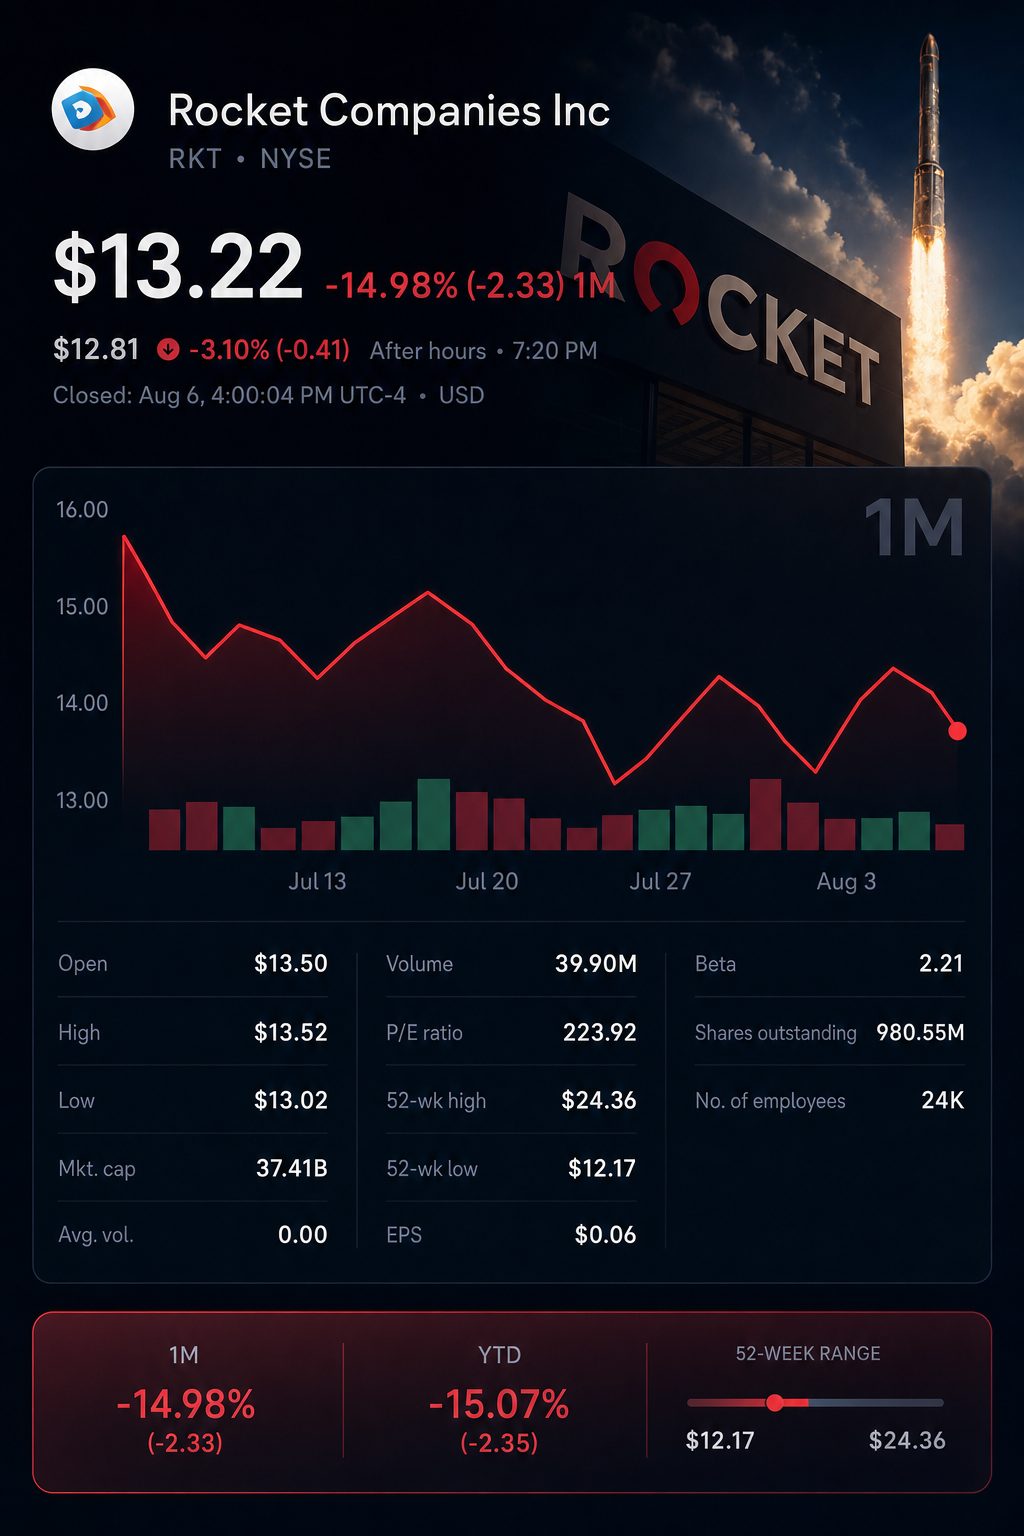
NEW YORK, August 6, 2026, 19:00 EDT — U.S. regular trading had ended, but after-hours activity continued.
- Rocket shares ended the session at $13.22, a decline of 4.6%, before dropping to $12.86 in after-hours trading.
- The midpoint of the third-quarter revenue guidance comes in 5.8% under the adjusted revenue for the second quarter.
- Initial estimates show that lower-margin channels accounted for 44.8% of rounded locks, yet contributed just 8.1% of the illustrative gain-on-sale value.
Rocket Companies, Inc. NYSE:RKT dropped by a further 2.7% in after-hours trading on Thursday, following a mixed performance in its second-quarter earnings update. The stock had already declined 4.6% during the regular session, closing at $13.22.
The key signal for investors was not just the record share of mortgages, but also the modest revenue generated from nearly half of the company’s lock volume.
Initial estimates indicate that Rocket Pro and correspondent channels accounted for 44.8% of total rounded channel locks, but contributed just 8.1% toward the illustrative gain-on-sale value.
The combination of these factors led to a 2.2% drop in adjusted revenue from the previous quarter. Despite this, closed mortgage volume increased by 9.8%. The third-quarter guidance midpoint of $2.6 billion signals a further decline of 5.8%.
Headline results showed a mixed performance. Revenue, GAAP earnings, and adjusted EBITDA all came in below consensus expectations. Adjusted earnings were in line with forecasts.
| Q2 2026 metric | Reported | Consensus | Variance |
|---|---|---|---|
| Total revenue | $2.784 billion | $2.810 billion | -0.9% |
| GAAP EPS | $0.08 | $0.11 | -27.3% |
| Adjusted EPS | $0.16 | $0.16 | Matches |
| Adjusted EBITDA | $766 million | $805 million | -4.8% |
Profitability differed widely by channel. Gain-on-sale margin for direct-to-consumer was 4.13%. Rocket Pro’s margin reached 0.69%, and the correspondent channel delivered 0.19%.
| Channel | Net locks | Share of rounded locks | GOS margin | Illustrative GOS value | Share of illustrative value |
|---|---|---|---|---|---|
| Direct-to-consumer | $26.0 billion | 55.2% | 4.13% | $1.074 billion | 91.9% |
| Rocket Pro | $10.9 billion | 23.1% | 0.69% | $75 million | 6.4% |
| Correspondent | $10.2 billion | 21.7% | 0.19% | $19 million | 1.7% |
Initial estimates calculate net locks using declared margins. The rounded channel locks amount to $47.1 billion, compared to the reported figure of $47.0 billion.
Rocket’s distribution expanded through increased partner volume at lower margins. This weighed on revenue conversion in the quarter. Investors will be watching to see if these partnerships can transition into direct lending and servicing recapture.
Rocket CEO Varun Krishna reported the company expanded its share in “one of the toughest spring housing markets in years.” Its purchase share climbed to 6.2% compared to 5.5%, while refinance share increased to 14.3% from 12.2%. “Markets change. Systems endure,” Krishna said. PR Newswire
Costs mitigated some of the mix impact. Adjusted EBITDA increased 3.8% from the previous quarter. The margin improved by 159 basis points to 27.7%, despite a 4.9% decline in lock volume.
| Metric | Q1 2026 | Q2 2026 | Sequential change |
|---|---|---|---|
| Adjusted revenue | $2.822 billion | $2.761 billion | -2.2% |
| Adjusted EBITDA | $738 million | $766 million | +3.8% |
| Adjusted EBITDA margin | 26.2% | 27.7% | +159 basis points |
| Closed originations | $44.7 billion | $49.1 billion | +9.8% |
| Net rate locks | $49.4 billion | $47.0 billion | -4.9% |
| Gain-on-sale margin | 2.74% | 2.48% | -26 basis points |
| Liquidity | $9.4 billion | $11.2 billion | +19.1% |
Liquidity improved through sales of mortgage-servicing-rights. Rocket secured $795 million in cash after selling $53 billion of unpaid principal balance. The company kept subservicing and recapture rights for close to 80% of the total. The volume sold made up a preliminary 2.65% share of its $2 trillion portfolio.
Year-over-year figures are not directly comparable. Rocket completed its purchase of Redfin on July 1, 2025, and Mr Cooper on October 1. As a result, examining quarter-on-quarter data offers a clearer indication of momentum.
Peer performance reflected wider industry pressures. UWM Holdings Corporation NYSE:UWMC dropped 35.3% following a quarterly loss of $451.9 million. loanDepot, Inc. NYSE:LDI slipped 9.3% on Thursday after announcing its results earlier this week.
| Company | Thursday price | Daily move | Q2 originations | Q2 net income/(loss) |
|---|---|---|---|---|
| Rocket Companies | $13.22 | down 4.6% | $49.1 billion | $229 million |
| UWM Holdings | $1.20 | fell 35.3% | $39.7 billion | $(451.9) million |
| loanDepot | $0.94 | down 9.3% | $8.0 billion | $(6.6) million |
The analyst environment was positive ahead of expected adjustments following the report. Rocket received Buy ratings from eight analysts, with two assigning Overweight and seven giving Hold ratings. There were no Underweight or Sell recommendations.
| Recommendation | Current | One month earlier |
|---|---|---|
| Buy | 8 | 8 |
| Overweight | 2 | 1 |
| Hold | 7 | 9 |
| Underweight | 0 | 0 |
| Sell | 0 | 0 |
| Consensus | Overweight | Overweight |
The mean price target stood at $19.23, suggesting a 45.5% increase from Thursday’s close. The lowest target, $15.50, represented a 17.2% gain, though updated guidance may reduce these differentials.
Rocket traded 2.5% higher compared to last Friday’s closing price in regular hours. However, the $12.86 quote after the market closed wiped out that gain from the past five sessions.
The pace of rate assessments remains rapid. The July jobs report is expected on August 7, with July inflation numbers set for release on August 12. The average 30-year fixed mortgage rate increased this week to 6.69%, up from 6.66%.
Risks: Increased rates may dampen buying demand and delay the recovery of refinancing. Ongoing expansion in lower-margin channels could put pressure on revenue conversion, and integrating acquisitions might result in additional expenses.
Rocket demonstrated its ability to capture market share amid a challenging housing environment. Investors are now looking for proof that these gains will translate into increased direct-to-consumer revenue.
Related articles: NYSE:RKT