Share price
$1.06
+$0.362 · +51.86% intraday
NEW YORK, August 28, 2026, 15:20 – Shares of Fangdd rose sharply by 51.9% as the company managed to trim its losses through cost-cutting measures, even though revenue fell 43%.
The market rewarded a faster cost reset than revenue decline. The operating improvement is real, but it came while the transaction base contracted.
Open: $0.676 · Prior close: $0.698. The stock traded above the prior close after opening below it.
| Metric | H1 2025 | H1 2026 | Change |
|---|---|---|---|
| Revenue | RMB203.4m | RMB115.7m | −43.1% |
| Closed-loop GMV | RMB8.0bn | RMB5.5bn | −30.8% |
| Gross profit | RMB18.5m | RMB15.3m | −17.1% |
| Gross margin | 9.1% | 13.2% | +410bp |
| Operating expenses | RMB90.2m | RMB41.2m | −54.3% |
| Net loss | RMB39.2m | RMB34.5m | −12.0% |
| Cash + restricted cash + investments | RMB107.2m |
| Six-month operating cash use | RMB36.7m |
| Liquidity / six-month cash use | 2.92× |
| Current liabilities | RMB177.6m |
| Market cap / H1 revenue | 2.39× |
| Market cap / annualized H1 revenue | 1.20× |
Market capitalization uses $1.06 and 38.55 million weighted-average shares. Multiples are arithmetic indicators, not analyst estimates.
The core debate: Fangdd removed RMB49.0 million of operating expense while revenue fell RMB87.6 million. That narrowed the operating loss by RMB45.8 million, but cash use and property-market exposure remain.
Weighted-average ordinary shares rose from 3.01 million to 38.55 million year over year.
That expansion dilutes each legacy share’s claim on any operating recovery. It also makes per-share comparisons less informative without a share-count adjustment.

Listings greatly exceed active demand, but the monthly payment burden remains near its 2026 high.
Updated Aug. 27, 2026Market/asset/sectorPrincipal and interest only. The rate increase adds about $176 monthly, or $2,112 annually.
| Metric | 2025 | 2026E | 2027E |
|---|---|---|---|
| Total home sales | 4.75M | 4.74M | 4.94M |
| Housing starts | 1.36M | 1.37M | 1.34M |
| 30-year rate, avg. | 6.6% | 6.5% | 6.7% |
| Mortgage originations | $1.96T | $2.17T | $2.29T |
Bullish: A sustained decline in Treasury yields lowers mortgage payments and unlocks sidelined demand without requiring deep discounts.
Bearish: Rates remain near 2026 highs, keeping buyer counts depressed and forcing builders to extend incentives.
Watch: Weekly mortgage rates, price-cut shares, pending sales and builder incentive use.

June price growth improved, yet inflation stayed faster. The national average also concealed an 8.9-point gap between Chicago and Seattle.
Case-Shiller annual change, June 2026. The zero line separates appreciation from decline.
The indices cover different mortgage and property populations. Their direction matters more than a point-for-point comparison.
Prices rose in 46 states plus Washington, D.C., and in 76 of the 100 largest metropolitan areas.
Case-Shiller is two months behind current conditions. Detroit’s June observation was unavailable because of Wayne County recording delays. Revisions, a rate move or a sharp inventory shift could change the apparent path before the next release.
Sources: S&P Cotality Case-Shiller, Federal Housing Finance Agency, NerdWallet mortgage rates, and Reuters/U.S. Census Bureau. Mortgage payment is principal and interest only; calculation uses 360 monthly payments.
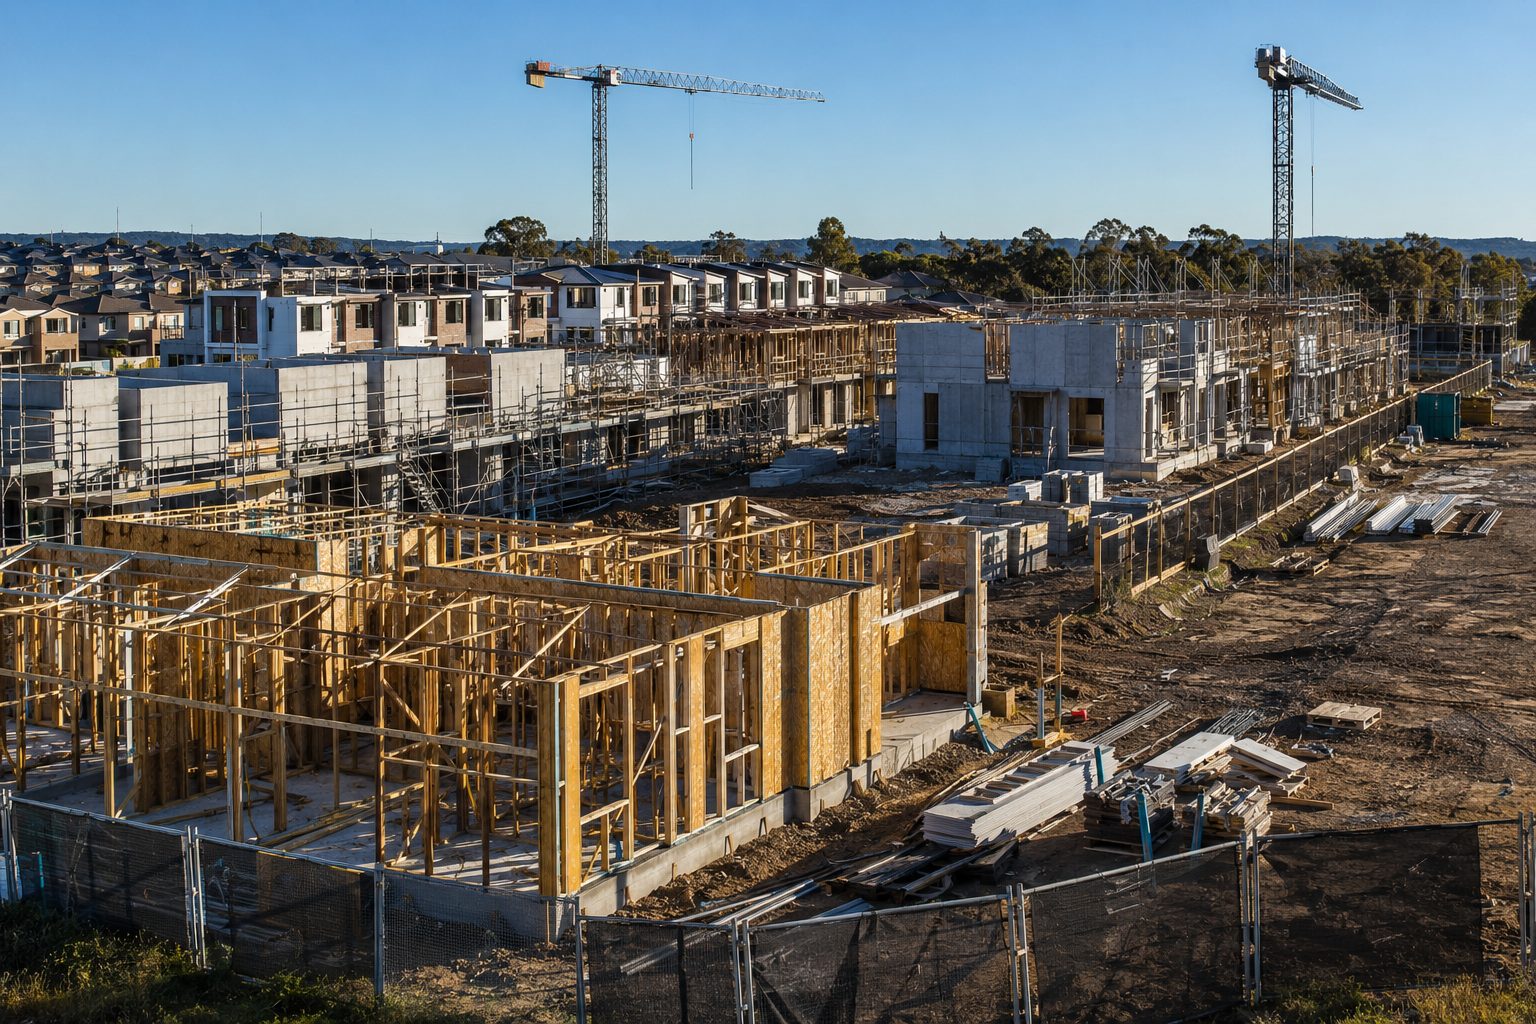
The administration is larger than one listed lender’s balance-sheet exposure. The key variables are fund-level loan concentration, project completion and the time required to turn first-mortgage security into cash.
Bars use separate scales: the first two compare borrower liabilities and CNI’s direct loan; the ASIC bar is a market snapshot, not Bathla exposure.
| Item | Current reading | Investor implication |
|---|---|---|
| Administrator | Teneo; Universal Property Group and Raj & Jai Construction | Control shifts to project stabilisation and creditor recovery |
| Bathla pipeline | 5,000+ homes on company website | Completion delays can tighten western Sydney supply |
| Centuria security | First mortgages; partial cross-collateralisation | Recovery depends on asset values and timing |
| ASIC private-credit survey | 22 managers, 52 funds, ~A$76bn AUM | Valuation and concentration are active enforcement themes |
| RBA system view | Private credit below 2% of financial-system assets | Systemic risk appears contained; fund-level risk can still be material |
| Next catalyst | First creditors’ meeting reported for 4 Sep 2026 | Watch secured debt, cash needs and project-by-project recovery |

| Indicator | Latest | Period |
|---|---|---|
| Mortgage applications | -0.4% | Week ended Aug. 14 |
| Purchase applications | -2.0% | Week/week |
| Refinance applications | +2.0% | Week/week |
| Refinance applications | -18% | Year/year |
| Housing starts | -12.4% | July |
| Building permits | +5.0% | July |
| Rate | Monthly P&I | Versus 6.65% |
|---|---|---|
| 6.00% | $2,398 | -$170 |
| 6.50% | $2,528 | -$40 |
| 6.65% | $2,568 | Baseline |
| 7.00% | $2,661 | +$93 |
A two-basis-point weekly decline saves about $5. A move from 6.65% to 6.00% saves nearly $170. The housing response is therefore more likely to depend on a sustained bond rally than one quiet week.
| Time (EDT) | Release | Baseline | Read-through |
|---|---|---|---|
| Tue., Aug. 25 • 10:00 | July new-home sales | June: 628,000 SAAR; 9.3 months’ supply | Homebuilders, materials, housing ETFs |
| Wed., Aug. 26 • 07:00 | MBA applications | Purchase -2%; refinance +2% | Mortgage lenders and regional banks |
| Thu., Aug. 27 • 12:00 | Freddie Mac PMMS | 30-year fixed 6.65% | Affordability and rate-sensitive equities |
Freddie Mac PMMS • Mortgage Bankers Association • U.S. Census housing starts • U.S. Census new-home sales. Daily 6.64% purchase quote: Zillow marketplace data published August 24, 2026, 06:00 EDT via Yahoo Finance.

Closing market data: August 24, 2026, 16:30 BST. Tax and policy data updated August 24, 2026.
Closes: 511.0p, 504.2p, 503.2p, 512.2p, 496.4p, 510.8p and 504.0p.
Low volume weakens any claim that Monday's move represented a decisive policy repricing.
Annual owner charge begins April 2028.
Uses the government's 2.5% costing assumption. At £2m, the implied £50K price effect equals 20 years of the £2,500 charge.
19 analysts: 9 Buy, 4 Hold, 6 Sell. Consensus: Hold.
| Signal | Current marker | Why it matters |
|---|---|---|
| Policy | Most valuations desk-based | Lower administrative friction |
| Housing | August asking prices −2% | Weak transaction backdrop |
| Monetisation | Agency ARPA +8% | Offsets volume pressure |
| New Homes | Developments −6% YoY | Guidance risk remains |
| Capital return | £400m+ planned | Supports per-share value |
| Scenario | Housing effect | Likely RMV effect |
|---|---|---|
| Limited behavioural response | Tax absorbed by wealthy owners | Little direct revenue impact |
| Price bunching near thresholds | More valuation disputes and repricing | More data demand, slower transactions |
| High-end sales retreat | Lower prime-market turnover | Pressure on agency customers |
| Listings stay elevated | Longer time to sell | Premium products may remain valuable |

Mortgage rates fell again, but the borrower saving remains too small to unlock broad refinancing. Rocket's $2 trillion servicing book preserves the upside if rates move farther.
| Metric | Q2 2026 | Investor signal |
|---|---|---|
| Closed mortgage volume | $49.1B | Scale amplifies volume shifts |
| Refinance market share | 14.3% | Record level |
| Servicing portfolio | $2.0T | 9.1 million recapture opportunities |
| Adjusted EBITDA | $766M | Most profitable quarter in four years |
| Total liquidity | $11.2B | Balance-sheet flexibility |
| Firm | Rating | Target | Latest action | Upside from $14.00 |
|---|---|---|---|---|
| RBC Capital | Sector Perform | $16 | Raised Aug. 12 | 14.3% |
| Keefe, Bruyette & Woods | Outperform | $19 | Cut Aug. 10 | 35.7% |
| JPMorgan | Neutral | $14 | Cut Aug. 7 | 0.0% |
| Benchmark | Buy | $19 | Cut Aug. 7 | 35.7% |
| Stephens | Overweight | $20 | Cut Aug. 7 | 42.9% |

CoStar's $800 million purchase brings profitable homebuilding data and marketplaces. The stock's premarket rebound says investors see potential. The valuation still requires growth.
Premarket observation: August 24, 2026, 07:28 EDT / 13:28 CEST. Premarket figures are preliminary.
The market is pricing a profitable subscription asset and cross-sell option, after the stock finished Friday unchanged.
| Measure | Figure |
|---|---|
| Cash consideration | $800M |
| 2025 revenue | ≈$170M |
| Implied adjusted EBITDA | ≈$39.1M |
| Price / revenue | 4.7× |
| Price / adjusted EBITDA | 20.5× |
| Deal / CoStar market cap | 6.1% |
Calculated from company-reported purchase price, revenue and margin.
| Q2 2026 | Value | YoY |
|---|---|---|
| Revenue | $925M | +18% |
| Adjusted EBITDA | $184M | +116% |
| Adj. EBITDA margin | 19.9% | — |
| Net income | $55M | vs. $6M |
| Residential revenue | $444M | +33% |
Residential adjusted EBITDA turned positive in the quarter.
| Firm | Rating | Target |
|---|---|---|
| JPMorgan | Overweight | $52 |
| BTIG | Buy | $42 |
| Citizens | Market Outperform | $35 |
| Citigroup | Neutral | $33 |
| Wolfe Research | Outperform | $32 |
| 21-analyst average | Buy | $37.10 |
Consensus upside from the observed premarket price: about 11.3%.
Market snapshot: August 24, 2026, 07:28 EDT / 13:28 CEST. Sources: Stocknear, CoStar Zonda closing release, CoStar Q2 2026, S&P Global analyst consensus via StockAnalysis.

Monday's 4.62% fall caused 59.7% of the weekly decline. Four further negative closes showed that investors kept cutting exposure after the update.
Recent quarter-on-quarter home-loan application changes reported by the banks.
| Bank | Friday close | Trailing P/E | Dividend yield | Screen signal |
|---|---|---|---|---|
| CBA | A$157.99 | 24.34× | 3.13% | Strong Sell |
| NAB | A$38.17 | 19.88× | 4.45% | Neutral |
| ANZ | A$37.13 | 18.97× | 4.47% | Neutral |
| Westpac | A$33.83 | 16.67× | 4.55% | Sell |
The A$10 billion reset has brought NAB closer to consensus value, not clearly below it. Monday's test is whether business-credit growth and a 4.45% trailing yield can stabilise the shares before weak mortgage demand turns into slower revenue or higher losses.
Catalyst: ASX reopeningSupport: A$38.06Next result: 5 Nov 2026
Market data: Aug. 21, 2026, 16:00 EDT
Friday official close; market now closed
Daily closes, Aug. 7–21, 2026
The liability fix is almost the size of the equity.
Maturity relief: the deal pushes major refinanced debt to 2032.
Price: a 9.25% coupon makes that extra runway costly.
Income support: Q2 NFFO rose to $0.15 a share and covered the $0.09 dividend.
Execution risk: asset-sale cash and tenant rent must arrive on schedule.
Nine analysts; consensus Hold
Sources: Medical Properties Trust Q2 2026 results, refinancing and dividend releases; FinanceCharts closing history; StockAnalysis analyst consensus. Market cap is $2.46 billion at the Aug. 21 close. Annual interest and percentage comparisons are calculated from disclosed figures. This dashboard is factual market context, not investment advice.

The dividend yield barely changed, but the 10-year yield rose. Realty Income's premium over Treasuries compressed from about 50 bp to 46 bp.
| Metric | Result | Signal |
|---|---|---|
| AFFO / share | $1.09 | +3.8% YoY |
| Revenue | $1.548B | +9.7% YoY |
| Occupancy | 98.8% | −10 bp QoQ |
| Rent recapture | 102.7% | Positive |
| Net debt / EBITDAre | 5.4× | Stable watch |
| Marker | Value | Context |
|---|---|---|
| Q2 investments | $2.6B | 7.3% cash yield |
| 2026 investment guide | $10.0B | Raised $0.5B |
| Liquidity, June 30 | $3.47B | Pro rata |
| 2031 convert | $1.0B | 3.75% coupon |
| Dividend / Q2 AFFO | 74.5% | Covered |

Hui Ka Yan’s life sentence closes a major criminal case. It does not repair Evergrande’s recovery gap. Vanke is the listed proxy to watch, with results due August 27 and a Sell analyst consensus.
| Broker | Rating | Target | From HK$2.44 | Date |
|---|---|---|---|---|
| JPMorgan | Sell | HK$1.60 | −34.43% | Aug. 17 |
| HSBC | Sell | HK$2.50 | +2.46% | Apr. 13 |
| Morgan Stanley | Hold | HK$2.45 | +0.41% | Apr. 8 |
| Goldman Sachs | Sell | HK$3.00 | +22.95% | Apr. 3 |

A one-day Treasury rally does not yet reset housing affordability. The cleaner signal is a sustained fall in the 10-year yield. That would lower borrower costs, revive refinancing and improve mortgage turnover. Until then, Rocket's servicing scale and liquidity matter more than the headline relief.