
NEW YORK, August 8, 2026, 15:06 (EDT)
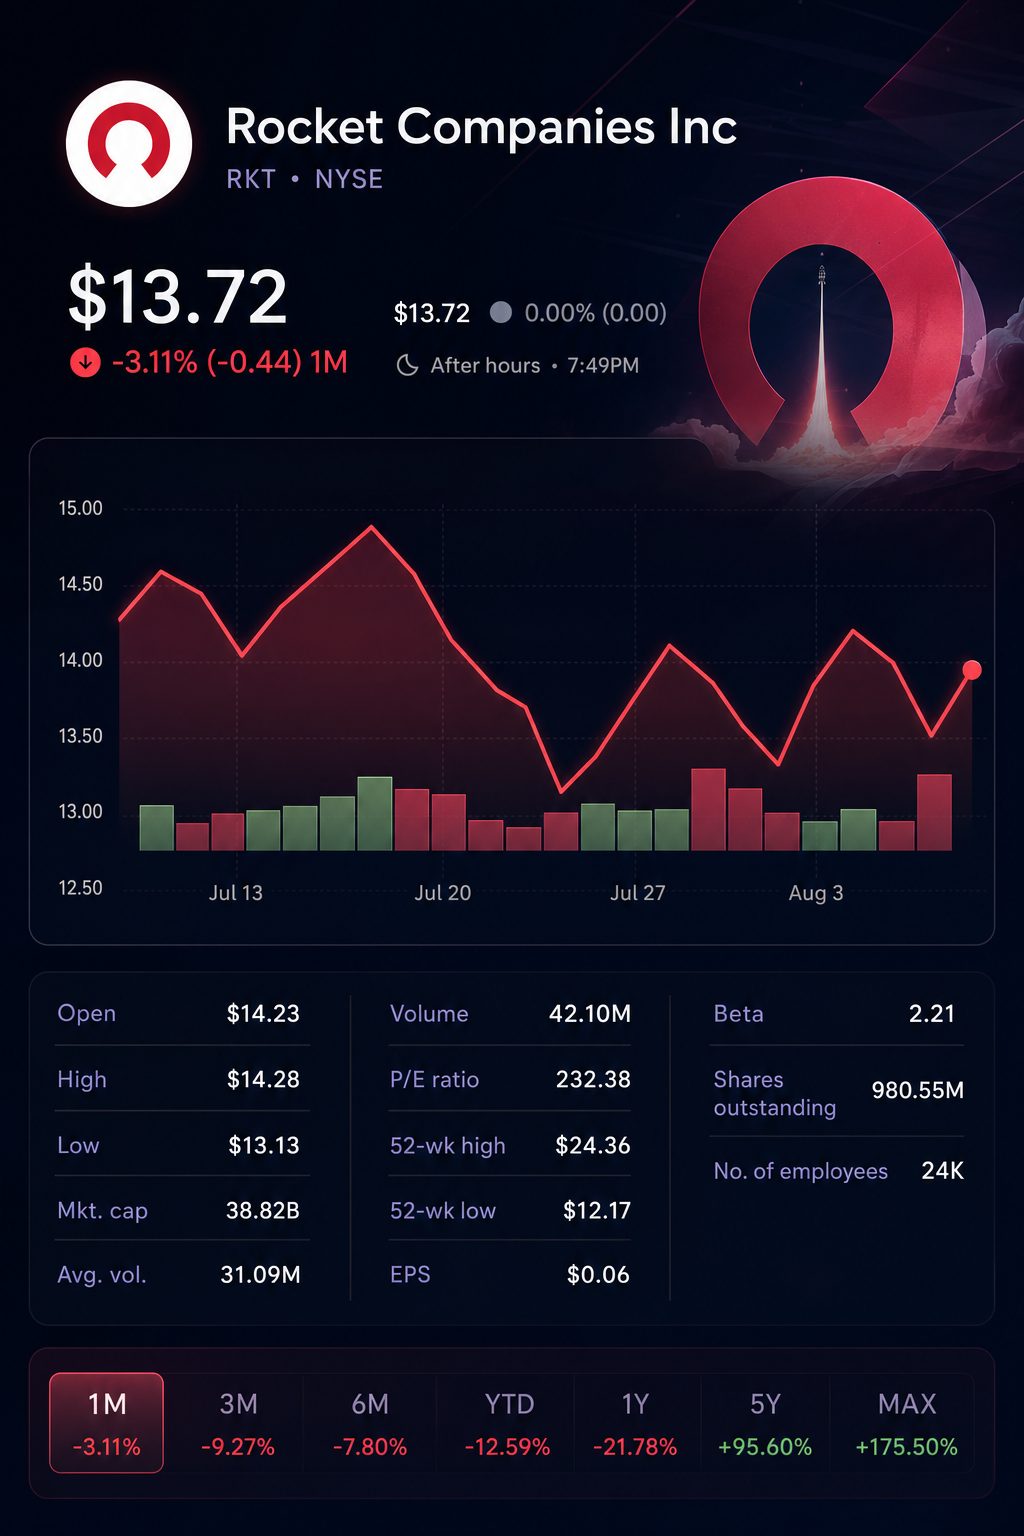
U.S. cash markets did not open on Saturday. Shares of Rocket Companies NYSE:RKT closed at $13.72 on Friday, an increase of 3.8% for the session. The stock was up 6.4% over the week. The most notable investor development in the report was a $795 million cash sale of servicing rights.
Rocket sold mortgage-servicing rights tied to $53 billion in unpaid principal balance. Based on the quarter-end book, this represented just 2.7% of its $2.0 trillion servicing portfolio. Subservicing and recapture services were retained on almost 80% of the pool sold. By calculation, cash received was equal to 104% of quarterly adjusted EBITDA.
Roughly $42 billion of sold principal continued to receive those services, according to the filing. The cash was not classified as operating profit. However, it contributed to $11.2 billion in total liquidity. The purchase share climbed to 6.2%, while the refinance share rose to 14.3%, both representing company highs.
Calculating servicing-sale
| Measure | Reported Q2 value | Calculated comparison |
|---|---|---|
| Total servicing portfolio | $2.0 trillion | 40.7 times Q2 originations |
| Servicing rights sold | $53 billion | 2.7% of servicing book |
| Cash proceeds | $795 million | 104% of adjusted EBITDA |
| Services retained | Nearly 80% | Roughly $42 billion of principal sold |
| Total liquidity | $11.2 billion | Comprises $3.1 billion in cash |
Revenue almost doubled in the latest quarter, reaching $2.784 billion, with GAAP net income climbing to $229 million. CEO Varun Krishna described it as “our most profitable quarter in four years.” The following numbers are unaudited. Rocket Companies
Rocket second quarter comparison
| Metric | Q2 2026 | Q2 2025 | Year-on-year change |
|---|---|---|---|
| Total revenue | $2.784 billion | $1.451 billion | +91.9% |
| GAAP net income | $229 million | $34 million | +574% |
| Adjusted revenue | $2.761 billion | $1.431 billion | +92.9% |
| Adjusted net income | $441 million | $75 million | +488% |
| Adjusted EBITDA | $766 million | $172 million | +345% |
| Adjusted diluted EPS | $0.16 | $0.04 | +300% |
Headline figures fell short of multiple expectations. GAAP EPS came in at $0.08, below the $0.11 estimate. Revenue was under the $2.81 billion projection. Adjusted EBITDA failed to meet the $805 million target, with adjusted EPS in line at $0.16.
Operating leverage continued to strengthen. Adjusted EBITDA margin climbed to 27.7%, compared to 12.0% in the same period last year. By calculation, mortgage contribution margin increased to 52.2% from 36.0%.
Rocket’s scale can be compared with those of its peers. UWM Holdings Corporation NYSE:UWMC posted a net loss of $451.9 million. loanDepot, Inc. NYSE:LDI recorded a quarterly loss of $6.6 million.
Comparison of nonbank lenders in Q2
| Company | Mortgage originations | Reported gain margin | Adjusted EBITDA | GAAP net income/(loss) |
|---|---|---|---|---|
| Rocket | $49.1 billion | 2.48% | $766 million | $229 million |
| UWM | $39.7 billion | 1.33% | $185.9 million | $(451.9) million |
| loanDepot | $7.99 billion | 2.86% | $20.5 million | $(6.6) million |
Rocket delivered adjusted EBITDA at 4.1 times UWM’s level on origination volume that was 24% higher. UWM reported $2.05 billion in equity and halted its dividend distribution. In comparison, Rocket generated cash from a minor portion of a pre-existing servicing asset. Lenders vary in how they define margin and structure their channel mixes.
Rocket’s internal data highlights the channel mix impact. Direct-to-consumer delivered a gain margin of 4.13%. Rocket Pro registered 0.69%, and correspondent lending reported 0.19%.
The release saw turbulent trading. Shares dropped 4.6% during Thursday’s regular hours and slid another 5.6% in after-market trading. On Friday, the stock gained 3.8%, recovering much of Thursday’s session loss. Trading volume hit 42.1 million shares, marking the week’s highest tally.
On Friday, five companies reduced their targets while keeping their existing ratings unchanged. Among them were Bank of America Corporation NYSE:BAC and Wells Fargo & Co. NYSE:WFC, as well as RBC Capital Markets, a division of Royal Bank of Canada NYSE:RY.
Analyst ratings following Q2
| Firm | Recommendation | Previous target | New target | Upside to $13.72 |
|---|---|---|---|---|
| Bank of America | Buy | $18.00 | $16.00 | 16.6% |
| Benchmark | Buy | $21.00 | $19.00 | 38.5% |
| RBC Capital Markets | Sector Perform | $20.00 | $15.00 | 9.3% |
| Wells Fargo | Equal Weight | $17.00 | $15.00 | 9.3% |
| Stephens | Overweight | $22.50 | $20.00 | 45.8% |
The updated five targets now average $17, which is 23.9% higher than Friday’s closing price. However, all targets decreased. Wells Fargo’s Donald Fandetti noted that Rocket “continues to gain market share.” Fandetti maintained that elevated 10-year yields remain a limiting factor for the mortgage market. TipRanks
Interest rates continue to drive short-term moves. Freddie Mac OTCMKTS:FMCC reported the average 30-year fixed mortgage rate at 6.69% on August 6, an increase from 6.66% the week prior. The latest figures will be released Thursday.
U.S. markets reopen on Monday, August 10. July consumer price index data is due on Wednesday, followed by producer price figures on Thursday. Early estimates from a Reuters poll forecast headline CPI at 3.4% and core CPI at 2.5% year-on-year. On Friday, the 10-year Treasury yield was around 4.64%.
Risks: Rising inflation or higher Treasury yields could weaken purchase demand and postpone refinancing activity. Rocket projects Q3 adjusted revenue between $2.5 billion and $2.7 billion, with the midpoint 5.8% lower than Q2. Adjusted net income stands at $441 million, while tax-effected net income after add-backs totals $209 million.
Related articles: NYSE:RKT