
SINGAPORE, August 16, 2026, 20:05 SGT — U.S. cash markets remain shut on Sunday.
- Grab saw 102.1 million shares change hands on Friday, more than double its three-month daily average volume at 2.05 times.
- The $750 million repurchase represents 4.9% of the market value as of Friday.
- Adjusted EBITDA increased by 54%, while adjusted free cash flow for the quarter dropped 35%.
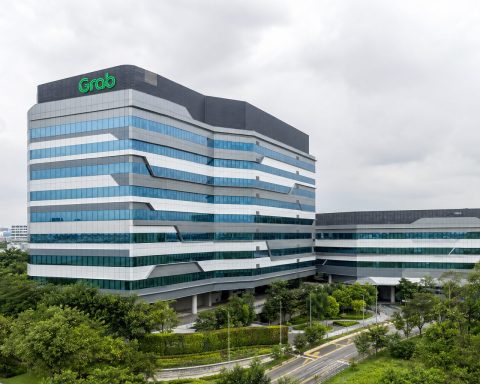
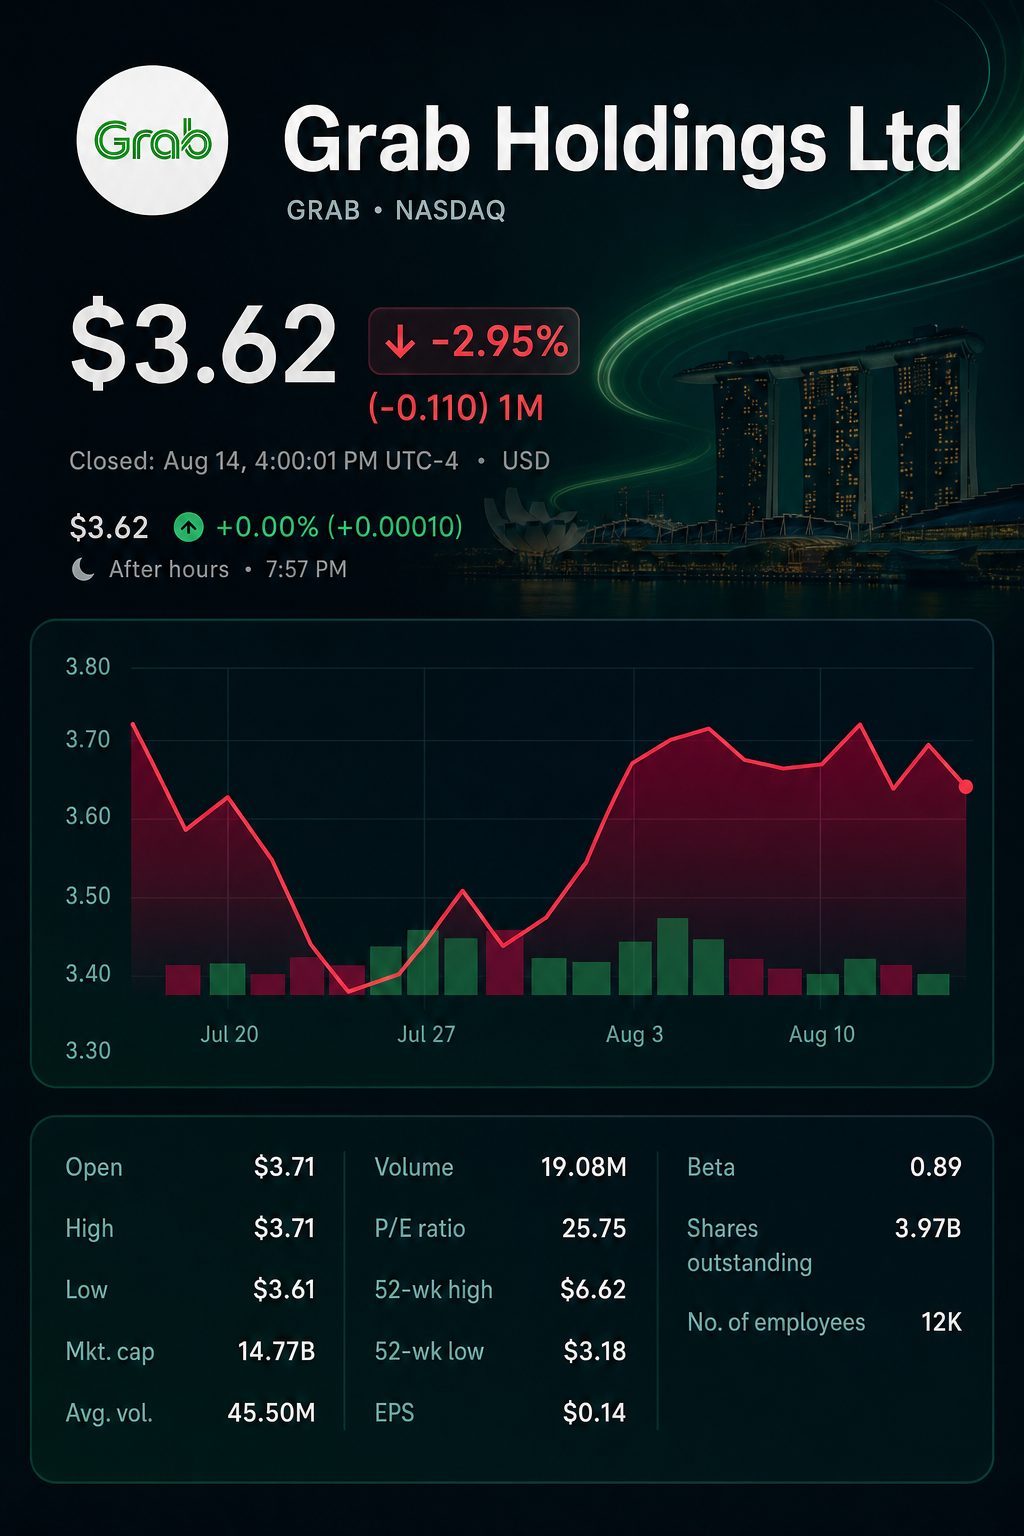
Grab Holdings Limited NASDAQ:GRAB finished Friday at $3.72, rising 1.4%, as trading activity surged to more than twice its usual pace. Approximately 102.1 million shares were traded, exceeding the three-month average volume of 49.7 million.
The move brings attention to Grab’s capital return plans for the next week. The fresh $750 million buyback programme represents 4.9% of the company’s $15.2 billion market capitalization as of Friday. At $3.72 per share, this amount would be enough to purchase roughly 202 million shares, prior to accounting for any fees or shifts in price.
This represents significant support, but it is not a promise. Grab can adjust both the speed and volume of its purchases depending on market conditions, and the authorization imposes no obligation to acquire a predetermined number of shares.
| Friday trading measure | Grab | Investor comparison |
|---|---|---|
| Close | $3.72 | 52-week band: $3.18–$6.62 |
| Daily move | +1.36% | Market shut for the weekend |
| Volume | 102.075 million | 3-month average stands at 49.746 million |
| Volume ratio | 2.05 times | Data source: Yahoo Finance |
| Market value | $15.215 billion | Buyback covers 4.9% |
At Friday’s close, shares were 43.8% under the 52-week peak and 17.0% higher than the 52-week low. The large spread indicates investors continue to weigh Grab’s stronger earnings against the pressures of competition, incentive costs and execution risk.
Operating performance improved in the second quarter. Revenue climbed 22% to $997 million. On-demand gross merchandise value, representing total transaction volume, rose 21% to $6.46 billion. Monthly transacting users hit a new high of 53.9 million.
| Second-quarter measure | Q2 2026 | Year-on-year change |
|---|---|---|
| Revenue | $997 million | up 22% |
| On-demand GMV | $6.463 billion | increase of 21% |
| Monthly transacting users | 53.9 million | rose 17% |
| Adjusted EBITDA | $168 million | climbed 54% |
| Adjusted EBITDA margin | 16.9% | was 13.3% in the prior year |
| Adjusted free cash flow | $73 million | down 35% |
Profit for the period increased to $235 million from $20 million. This result reflected a one-off $307 million gain linked to the consolidation of Superbank. Operating profit, which excludes that remeasurement gain, totaled $19 million.
Cash generation showed less consistency. Adjusted free cash flow declined to $73 million compared to $112 million. Increased capital expenditures and working-capital requirements countered gains in earnings. Adjusted free cash flow over the trailing 12 months amounted to $450 million.
Grab allocated $706 million for consumer and partner incentives. This amount represented 70.8% of its reported revenue and 10.9% of on-demand GMV. Part of this rise was used to assist drivers facing higher fuel expenses and to encourage use of more affordable service tiers.
Grab Chief Financial Officer Peter Oey stated the company “cut out nearly 40,000 hours of sales inefficiencies” with AI-based processes. Oey added that product shipping speed was now three times faster than the previous year. Reuters
Management lifted both full-year targets. The revenue forecast was raised by $55 million at the midpoint, up 1.4%. Adjusted EBITDA guidance climbed by $20 million at the midpoint, an increase of 2.8%.
| 2026 guidance | Current range | Previous range | Midpoint change |
|---|---|---|---|
| Revenue | $4.10–$4.15 billion | $4.04–$4.10 billion | +$55 million |
| Adjusted EBITDA | $720–$740 million | $700–$720 million | +$20 million |
| Implied revenue growth | 22%–23% | 20%–22% | Approximately +1.4% at midpoint |
| Implied EBITDA growth | 44%–48% | 40%–44% | Approximately +2.8% at midpoint |
Analysts continue to express optimism following the results. The consensus target price of $5.88 represents a potential gain of 58.0% from Friday’s close. The lowest target, at $4.50, is still 21.0% higher than $3.72.
| Analyst | Recommendation | Target | Move from $3.72 |
|---|---|---|---|
| Evercore ISI | Buy | $8.00 | up 115.1% |
| Benchmark | Buy | $7.00 | increase of 88.2% |
| Bernstein SocGen | Buy | $5.90 | gain of 58.6% |
| JPMorgan | Buy | $5.70 | rises 53.2% |
| Barclays | Overweight | $5.00 | up 34.4% |
Risks: Grab’s incentives could remain high if fuel prices climb or competition in the region increases. Swift growth in loans heightens credit loss risk. Additionally, the buyback process might be slow, offering less immediate support should funds shift to acquisitions or expansion.
In the coming week, trading volume will serve as the clearest indicator. Sustained action above the 49.7 million-share average would indicate ongoing interest. Should activity return to typical levels, attention will shift to guidance delivery and any share buyback announcements as the next key drivers.
Related articles: NASDAQ:GRAB