
DEARBORN, Michigan, August 16, 2026, 15:12 EDT — Ford (F.N) would see costs from a proposed trade regulation amounting to 19% of its profit projection, according to analysts.
- Detroit carmakers caution that suggested North American trade regulations may each increase yearly costs by at least $2 billion.
- For Ford, this amount represents 19% of its increased 2026 adjusted EBIT forecast.
- Ford’s commercial vehicle division continues to serve as the primary buffer for margins.
Ford Motor Company NYSE:F begins the week facing a trade-policy risk that matches roughly 19% of its updated annual profit forecast. Industry estimates cited Thursday suggest that new rules on North American content may cost every Detroit automaker a minimum of $2 billion annually.
The contrast is clear. Ford projects adjusted earnings before interest and taxes of between $10 billion and $11 billion in 2026. A $2 billion cost amounts to 19.0% of the $10.5 billion midpoint.
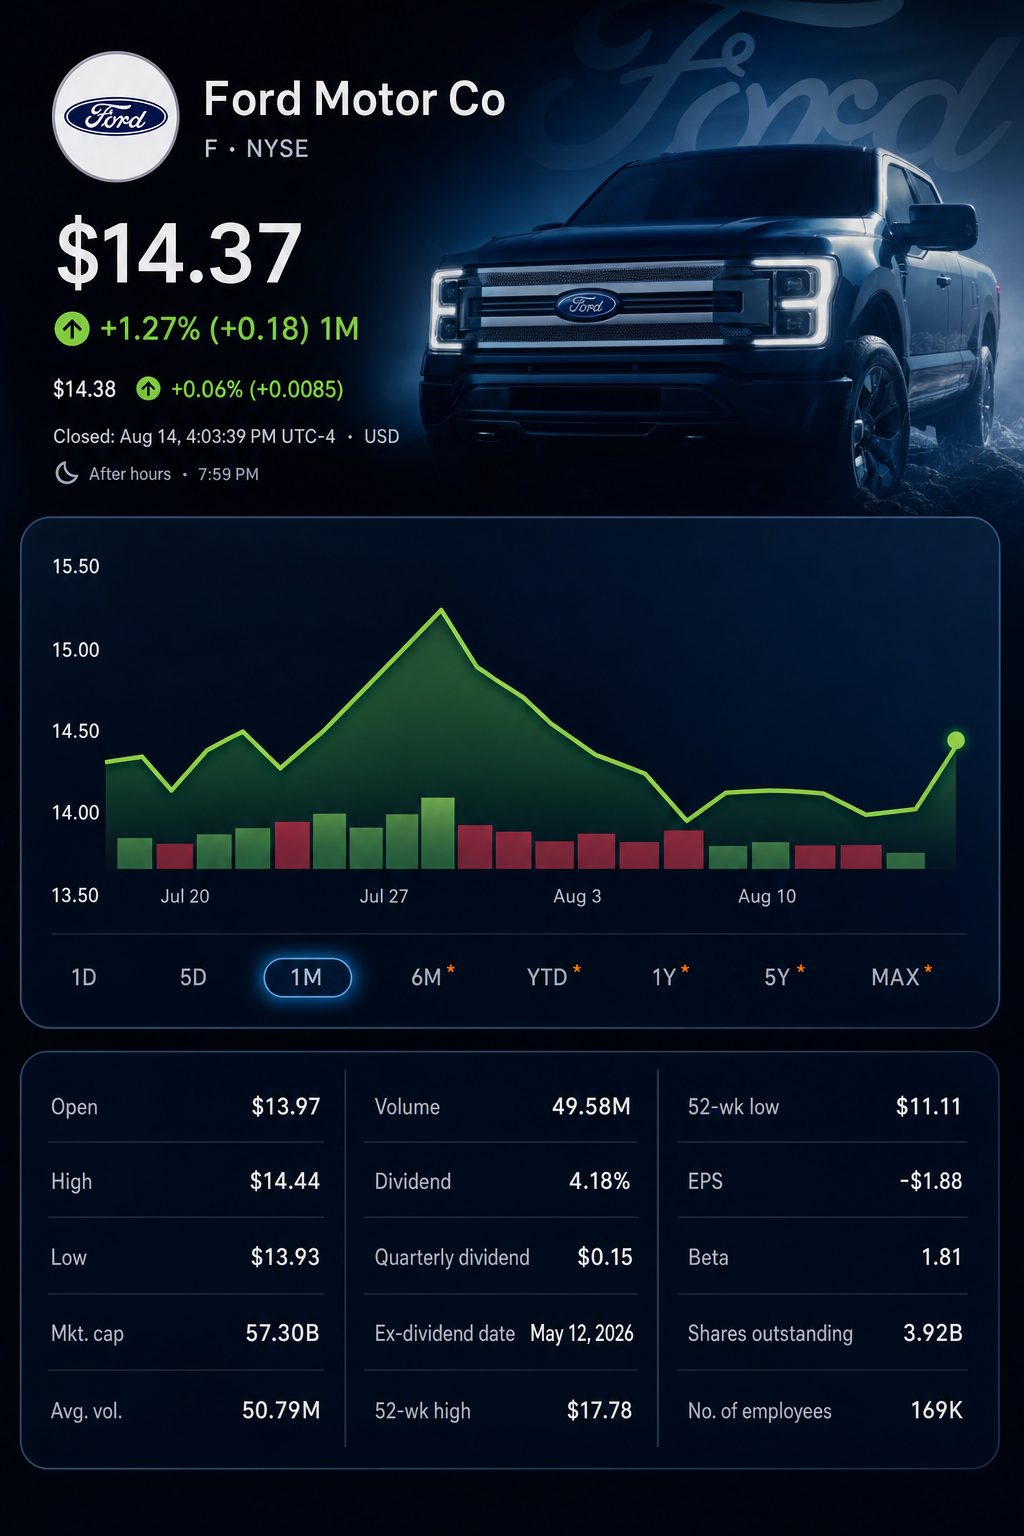
U.S. cash markets did not open on Sunday. The most recent independently confirmed Ford price used in this report was $13.83 at Wednesday’s close, marking a drop of 1.1% for that session. The ongoing policy debate presents investors with a new challenge for Monday.
| Trade-cost measure | Amount | Share of 2026 EBIT midpoint |
|---|---|---|
| Ford’s current 2026 tariff projection | About $1.0bn | 9.5% |
| Sector projection with proposed regulations | At least $2.0bn | 19.0% |
| Midpoint of Ford’s revised EBIT forecast | $10.5bn | 100% |
The proposal mandates a minimum of 50% U.S.-produced content and could increase the North American requirement from the present 75%. Ford and other automakers maintain that tougher regulations might drive up expenses and reduce export competitiveness.
Ford’s most recent quarter gives it some breathing room. The company posted revenue of $48.3 billion, with adjusted EBIT climbing 17% to $2.5 billion. Adjusted free cash flow totaled $2.1 billion.
| Q2 2026 segment | Revenue | Adjusted EBIT | Calculated margin |
|---|---|---|---|
| Ford Blue | $26.1bn | $1.1bn | 4.2% |
| Ford Pro | $17.8bn | $1.7bn | 9.6% |
| Ford Model e | $1.0bn | -$919m | -91.9% |
| Total company | $48.3bn | $2.5bn | 5.2% |
Ford Pro delivered the highest operating margin, posting a 9.6% calculated margin, which was more than twice the 4.2% margin reported by Ford Blue. Model e continued to post a loss, losing nearly 92 cents for every dollar of revenue.
Following the quarter, management increased the EBIT midpoint by $1 billion, representing a 10.5% lift over the previous midpoint. Guidance for free cash flow was also boosted by $1 billion.
| 2026 outlook | Previous | Current | Midpoint change |
|---|---|---|---|
| Adjusted EBIT | $8.5bn-$10.5bn | $10.0bn-$11.0bn | +$1.0bn |
| Adjusted free cash flow | $5.0bn-$6.0bn | $6.0bn-$7.0bn | +$1.0bn |
| Capital spending | $9.5bn-$10.5bn | $9.5bn-$10.5bn | No change |
Chief Executive Jim Farley said with the results, “Ford is becoming a more profitable, better-run, and truly different company.” The trade review will indicate how much of that progress withstands increased sourcing costs. Ford
Wall Street opinion is split. Three major firms have set recent targets between $15 and $20. The variation highlights contrasting perspectives on truck pricing, warranty cost reductions, and losses from electric vehicles.
| Firm | Date | Recommendation | Price target | Action |
|---|---|---|---|---|
| Citigroup | July 29, 2026 | Buy | $20 | Increased from $19 |
| JPMorgan | July 29, 2026 | Overweight | $17 | Lifted from $16 |
| Morgan Stanley | July 29, 2026 | Equal-weight | $15 | Bumped up from $14 |
Risks: The trade language is not yet finalized, and industry cost projections are still preliminary. A more lenient rule may ease the overhang. Conversely, a tougher rule could pressure margins unless Ford adjusts prices or sourcing strategies.
Negotiations with Mexico and Canada will be in focus in the week ahead. Investors will be monitoring any adjustments to Ford’s expected $1 billion tariff impact. A change would directly affect the 19% comparison figure.
Related articles: NYSE:F