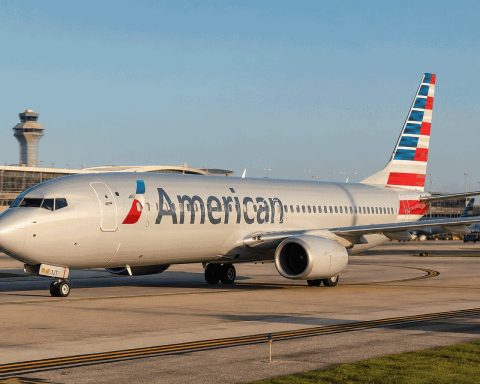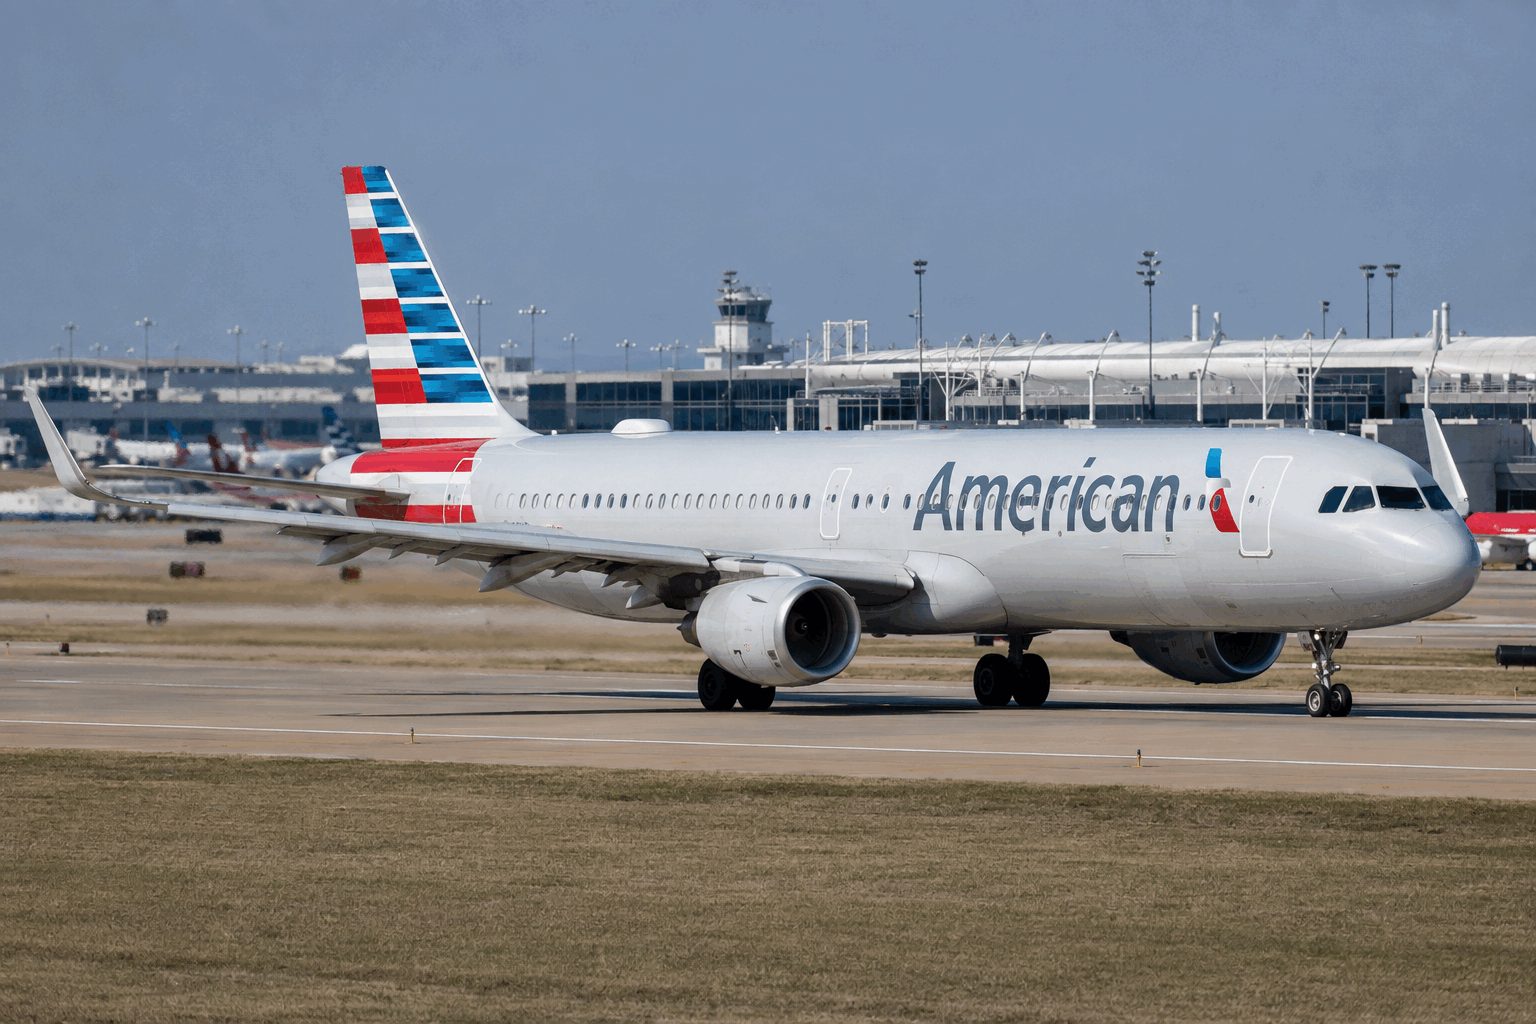

FORT WORTH, August 29, 2026, 14:18 (ET) – American Airlines (AAL.O) stock dipped 0.6% after reporting record-high revenue and a net margin of 0.4%.
- American Airlines stock ended Friday at $13.64, slipping 0.58%, with 63.4 million shares traded.
- Revenue for the second quarter climbed 16.3%, reaching a record $16.7 billion.
- GAAP net income totaled $71 million, resulting in a net margin of approximately 0.4%.
- The company projects an adjusted loss per share between $0.70 and $0.10 for the third quarter.
American Airlines Group Inc. (NASDAQ: AAL) ended Friday down 0.58%, with trading volumes substantially above average. The stock finished the session at $13.64 on 63.4 million shares traded.

The increase was slight. However, pressure on underlying earnings remains. Record-high sales bring minimal profit as rising fuel expenses consume the additional revenue.
American posted second-quarter revenue of $16.7 billion, representing a 16.3% increase. GAAP net income was just $71 million, resulting in an estimated net margin of about 0.43%.
Fuel accounts for a large portion of the difference. The company’s quarterly fuel costs rose by over $2.2 billion, or 83%. The company said that higher fares compensated for almost half of this impact.
However, demand stayed strong. Premium passenger unit revenue was up 13.4%. Managed corporate revenue grew 26%, and domestic passenger unit revenue advanced 10.6%.
| Investor measure | Verified figure | Why it matters |
|---|---|---|
| Q2 revenue | $16.7 billion; +16.3% | Driven by unprecedented demand and higher prices |
| Q2 GAAP net income | $71 million | Accounts for about 0.4% of total revenue |
| Available liquidity | $11.3 billion | Ensures ability to run business and manage debt |
| Q3 revenue guide | +16% to +19% | Growth pace expected to hold steady |
| Q3 adjusted EPS guide | ($0.70) to ($0.10) | Fuel expenses continue to offset expansion |
Management projects a 16% to 19% increase in third-quarter revenue. However, it anticipates an adjusted per-share loss in the range of $0.70 to $0.10. The forecast is based on fuel prices averaging around $3.75 per gallon.
Liquidity gives the company flexibility. American closed June with $11.3 billion in available resources. It also refinanced its sole significant 2027 maturity during the quarter.
The company’s market capitalization stands at about $9 billion based on Friday’s closing price. Analysts are split, with 12 recommending buy, 11 advising hold, and two suggesting sell, and an average price target of $18.50.
Trading among peers was softer. Delta Air Lines (NYSE: DAL) slipped 1.32%, and United Airlines (NASDAQ: UAL) retreated 1.59%. American’s lesser drop does not close its earnings gap.
The upcoming earnings report will reveal if pricing growth keeps pace with fuel expenses. Investors should monitor realized fuel costs, unit revenue, and CASM excluding fuel, as each has a direct impact on the narrow margin.
Risks stay significant. Fuel prices may fluctuate dramatically, demand typically follows cycles, and labor disputes can increase expenses. Elevated debt levels also limit flexibility should cash flow decline.
Related articles: NASDAQ:AAL