Marcin Frąckiewicz is the founder of TechStock² and CEO of TS2 Space. He writes about publicly traded space and satellite companies, telecommunications, AI infrastructure and the market forces shaping those sectors. Follow him on Google News or LinkedIn.
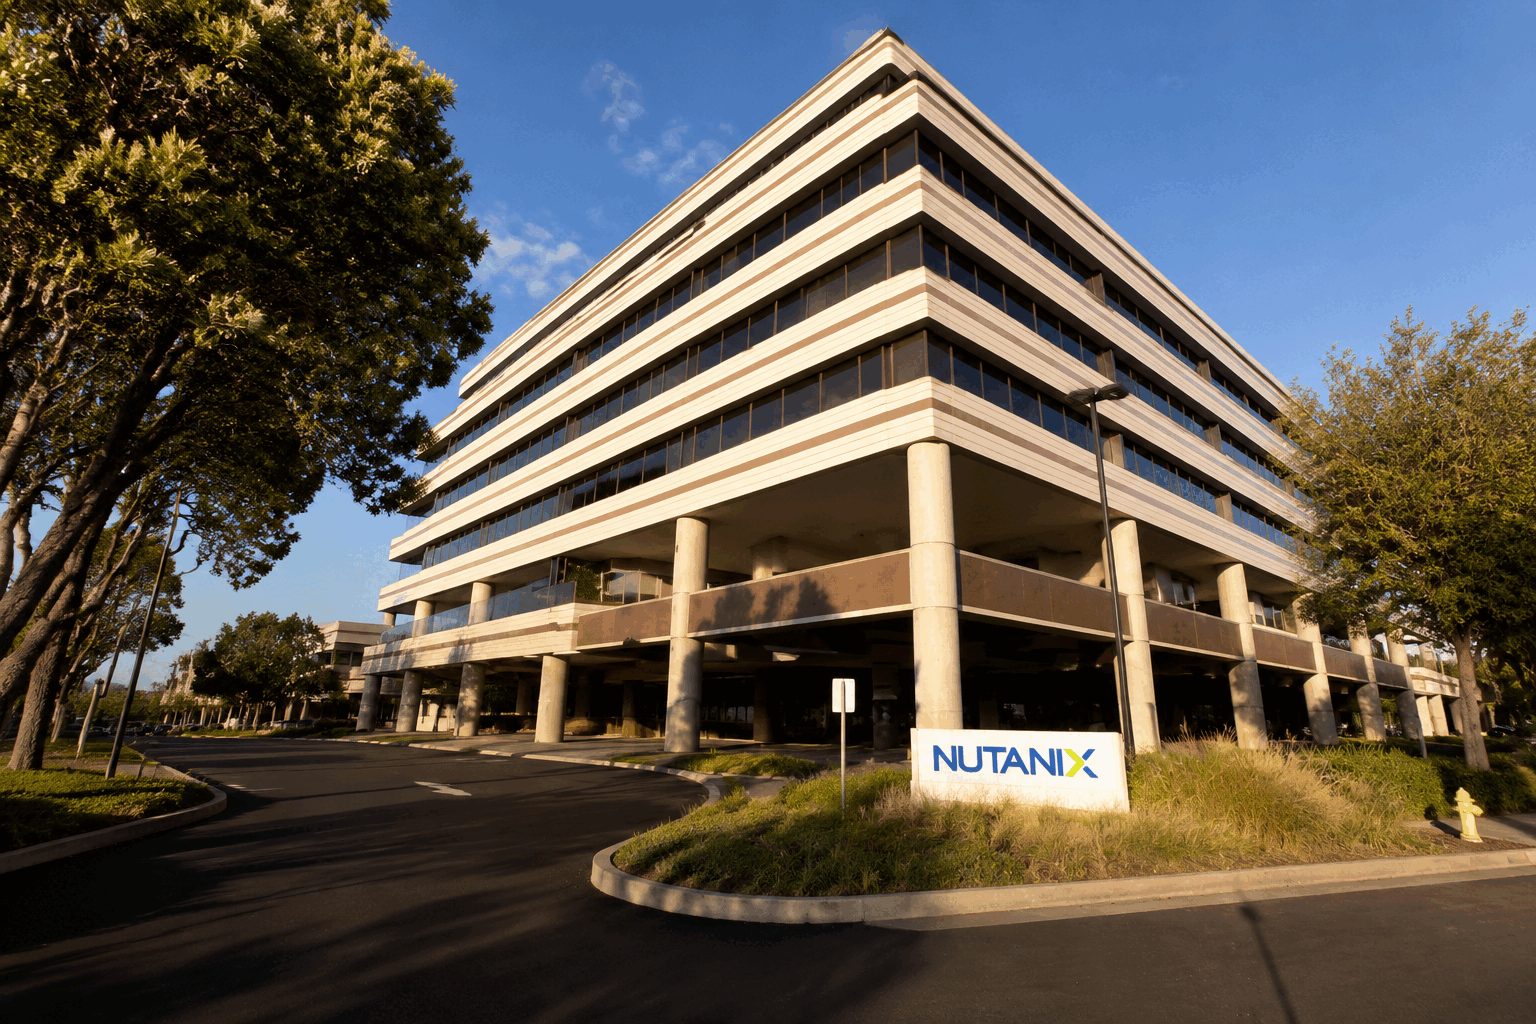
Nutanix Inc. shares rose 7.2% in after-hours trading on Wednesday. The hybrid-cloud firm surpassed analyst forecasts for both revenue and profit in the quarter.
·2 min read
NASDAQ: NTNX · Earnings reaction
Nutanix investor dashboard
Market data: Aug. 26, 2026, 17:22 EDT Financials: quarter ended July 31, 2026
After-hours price
$70.10
+$4.71 · +7.20%
Equity value added
$1.27B
Estimated from 270.32M shares
Trading activity
4.66M
1.88× 2.48M average volume
52-week position
74%
$34.01 low · $82.42 high
Quarterly surprise
Metric
Actual
Consensus
Beat
Revenue
$757.1M
$738.3M
+$18.8M
Adjusted EPS
$0.60
$0.49
+$0.11
Growth and margin
Q4 FY2025Q4 FY2026
Operating scoreboard
Metric
Q4 FY26
Q4 FY25
Change
Revenue
$757.1M
$653.3M
+16%
ARR
$2.55B
$2.20B
+16%
Adj. gross margin
87.7%
88.3%
−60 bps
Adj. operating margin
26.2%
18.3%
+790 bps
Free cash flow
$277.6M
$207.8M
+34%
Fiscal 2027 guide
Revenue$3.18B–$3.23B
Midpoint growth12.5%
Adj. operating margin24%–25%
Free cash flow$850M–$950M
Q1 revenue$755M–$765M
Q1 adj. operating margin26%–28%
Implied market cap
$18.95B
At $70.10 after hours
FY27 sales multiple
5.9×
Using $3.205B midpoint
FY27 FCF multiple
21.1×
Using $900M midpoint
Analyst setup
Moderate Buy
18 ratings · $64.21 mean target before results
What moved the stock
Revenue exceeded consensus by 2.5%. Adjusted operating margin expanded 790 basis points. ARR kept pace with quarterly revenue at 16% growth. Fiscal-2027 guidance preserved double-digit sales growth while keeping adjusted operating margin near one quarter of revenue.
Risk monitor
Adjusted gross margin fell 60 basis points. Server supply constraints can delay deployments and cash collection. The after-hours price already exceeds the pre-report average analyst target. Extended-hours liquidity can exaggerate moves.
Sources: Nutanix fiscal Q4/FY2026 release; MarketBeat earnings estimates and analyst consensus; StockAnalysis after-hours quote and share data. Valuation figures are calculated estimates. Prices and volume are time-sensitive.
WARSAW, August 26, 2026, 21:10 CEST — Shares in Snap Inc. dropped 7.94% to $5.45 on Wednesday afternoon as a youth-safety lawsuit in Pennsylvania…
·4 min read
S
Snap Inc. NYSE: SNAPEvent-driven investor dashboard
Regular session · delayed feed
Pennsylvania teen-safety lawsuit
Snap slides 7.9% as a new state case sharpens the legal overhang
Pennsylvania sued Snap under its consumer-protection law, alleging deceptive safety and age-rating claims and an addictive, high-risk design for minors. These are allegations, not findings; the complaint specifies no dollar liability.
$5.45−$0.47 / −7.94%
Prior close $5.92Open $5.97Day $5.33–$6.0152-week $3.81–$9.28
Market snapshot: Aug. 26, 2026, 2:47:31 p.m. EDT · latest trade in delayed consolidated feed · retrieval 3:02:58 p.m. EDT
Volume52.0M
1.24× 3-month average of ~41.93M · Aug. 26, 2:47 p.m. EDT
From 52-week high−41%
Derived from $5.45 and $9.28 · Aug. 26 snapshot
From 52-week low+43%
Derived from $5.45 and $3.81 · Aug. 26 snapshot
Tape check
All values: Aug. 26, 2026, about 2:47 p.m. EDT · delayed
Where the latest trade sits
Day $5.33 52W $3.81Latest $5.45Day $6.01 52W $9.28
Peer tape
SnapNYSE: SNAP · P/E N/M
$5.45
−7.94%
Meta PlatformsNASDAQ: META · TTM P/E ~21.9×
$580.65
+1.86%
PinterestNYSE: PINS · TTM P/E ~68.9×
$23.41
−1.06%
SNAP underperformed META by 9.80 percentage points and PINS by 6.88 points at the same snapshot. That comparison supports a stock-specific repricing; it does not prove the lawsuit caused every part of the move.
Reuters reported that Meta separately agreed to pay up to $18 billion and make youth-safety product changes. Snap is not a party to that settlement, but its scale supplies a same-day industry benchmark for legal and product-remedy risk.
Catalyst: what Pennsylvania filed
Public redacted complaint dated Aug. 25, 2026
!
Commonwealth v. Snap Inc.
Philadelphia Court of Common Pleas · Pennsylvania Unfair Trade Practices and Consumer Protection Law (UTPCPL)
The state alleges Snap understated mature content to secure age ratings suitable for users 13 and older.
It challenges features including infinite scroll, autoplay, notifications, Snapstreaks, friend discovery, location sharing and ephemeral messages as deceptive or unfair for minors.
The requested relief includes declarations, temporary and permanent injunctions, civil penalties, costs, fees and other equitable relief.
No dollar damages amount is stated in the complaint’s prayer for relief.
Snap said the allegations “fundamentally misrepresent our platform and our approach to teen safety,” and said it remains focused on strengthening safeguards. The case is at the allegation stage.
Why the market can care before damages are known
The near-term issue is remedy uncertainty. An injunction could matter through product design, marketing, compliance cost or engagement—not only through a cash penalty.
ComplaintUTPCPL claims filed Aug. 25
Possible remedyOnly if the state prevails or parties settle
Product effectDesign, ratings, marketing or youth safeguards
Financial channelEngagement, ad inventory, cost or cash outflow
Risk transmission, not a forecast. Snap’s Aug. 4 10-Q—filed before this Pennsylvania case—already said youth-harm litigation outcomes were uncertain and that it could not estimate a reasonably possible loss range for those matters.
Fundamental counterweight
Q2 2026 · three months ended June 30, 2026 · company-reported
Q2 scorecard
Metric
Q2 2026
Q2 2025
YoY
Revenue
$1.599B
$1.345B
+19%
Advertising revenue
$1.283B
$1.174B
+9%
Other revenue
$316M
$171M
+85%
Adjusted EBITDA
$250M
$41M
+505%
Net loss
$(164)M
$(263)M
38% narrower
Free cash flow
$121M
$24M
+407%
Average DAU
493M
469M
+5%
Global ARPU
$3.25
$2.87
+13%
Exact reported figures were $1,598.993M revenue, $249.615M adjusted EBITDA, $(163.960)M net loss and $120.538M FCF. Adjusted EBITDA and FCF are non-GAAP measures.
Revenue is diversifying; core-market users are the watchpoint
Advertising$1.283B
Other / direct$316M
Ad mix fell from 87.3% a year earlier; subscription-led other revenue rose to 19.8%.
North America DAU−7%Q2 2026 YoY
Europe DAU−2%Q2 2026 YoY
Rest-of-world DAU+12%Q2 2026 YoY
Paying penetration<3%of 971M Q2 MAU; no exact subscriber count disclosed
Outlook, estimates and valuation
Company outlook Aug. 3 · consensus estimate update Aug. 18 · market inputs Aug. 26
Company outlook
Q3 revenue$1.70–1.74BCompany guide · Aug. 3, 2026
Q3 adj. EBITDA$300–350MCompany guide · Aug. 3, 2026
FY infrastructure$1.65–1.70BRaised from $1.60–1.65B
FY stock comp.~$1.05BCompany outlook · Aug. 3
The Q3 revenue range implies roughly 12.8%–15.5% growth versus Q3 2025, derived from $1.5068B.
Street estimates
FY2026 revenue$6.69BVendor consensus · updated Aug. 18, 2026
FY2026 GAAP EPS−$0.10Vendor consensus · updated Aug. 18, 2026
Implied revenue growth~13%Derived vs. FY2025 revenue $5.931B
Company 2027 viewGAAP profitManagement expects sustained positive net income
Consensus is an aggregate, not company guidance, and can change after legal or operating developments.
Snapshot valuation
Market cap / TTM sales~1.4×$9.1B / $6.351B
EV / TTM adj. EBITDA~9.7×Approx. EV $9.9B / $1.023B
Market cap / TTM FCF~12.9×$9.1B / $706M
GAAP P/EN/MTTM GAAP net loss
Derived using the Aug. 26 intraday market value and June 30 balance sheet: $2.660B cash/securities and $3.535B debt. Snap reported 1.691B shares outstanding across all three classes as of July 30; vendors can use different share-count conventions. These are mixed-date approximations.
The $11 spread between low and high targets signals unusually broad model uncertainty. Targets are opinions, not promised outcomes.
What changes the setup
Observable checkpoints, not predictions
Legal
Relief becomes concrete
A quantified penalty, injunction request, adverse preliminary ruling or settlement term would replace today’s open-ended exposure with a more modelable cost or product constraint.
October 2026
Bellwether cases
Snap’s June 30 filing said the next two California JCCP youth-harm bellwether trials involving Snap were scheduled for October. Trial timing or resolution can reset risk expectations.
Operating proof
Q3 delivery
Revenue inside the $1.70B–$1.74B guide and adjusted EBITDA inside $300M–$350M would test whether Q2’s ad recovery and direct-revenue growth persist through the legal noise.
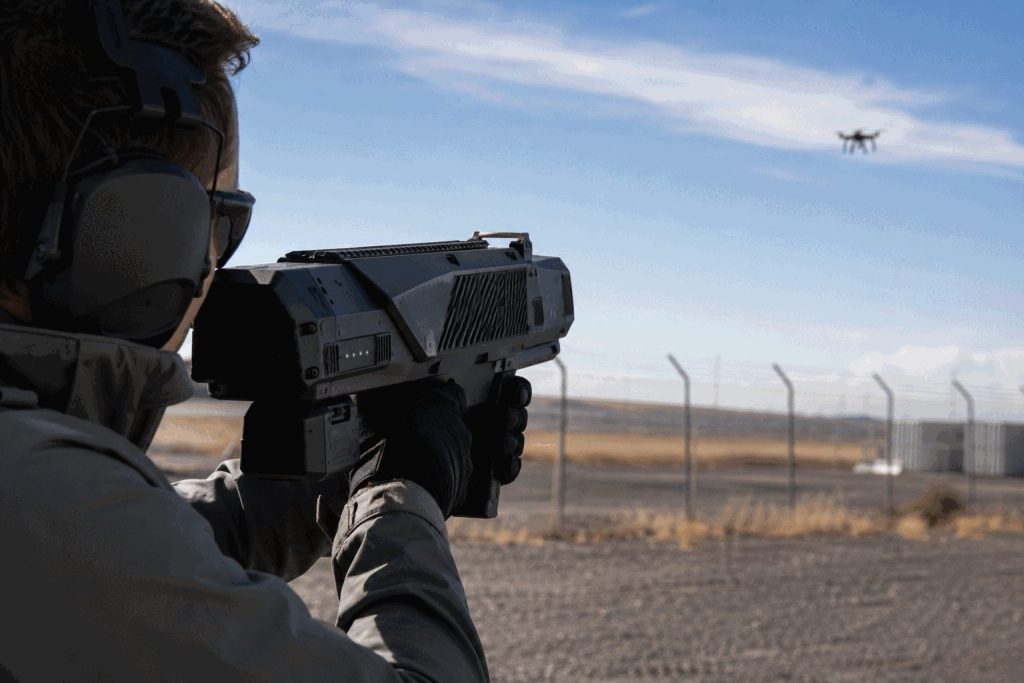
Shares in DroneShield Limited dropped 9.4% on Wednesday, finishing at A$1.768 as higher first-half costs offset its record sales.
·3 min read
ASX:DRO · Company · Stock move
Sales landed. Profit did not.
Market data: 26 Aug 2026, 16:12 AEST Results: six months ended 30 Jun 2026
CloseA$1.768−9.4% · A$0.182
Quoted value erasedA$168m924.09m shares × A$0.182
1H revenueA$125.8m+74% · met consensus
Statutory lossA$32.2mA$6.6m profit expected
Half-year scorecard
A$ million
1H25
1H26
Change
Revenue
72.3
125.8
+74%
Recurring revenue
3.5
11.5
+229%
Gross margin
65.3%
60.0%
−5.3 pts
Underlying EBITDA
8.0
−12.4
−20.4
Statutory NPAT
2.1
−32.2
−34.3
Revenue growth+74%
Margin erosion−5.3 pts
The guide is mostly covered
Cash: A$180m at 30 Jun; no debt.
Remaining sales: A$10m–A$30m.
Core test: restore EBITDA and gross margin.
Market reaction: four times the earnings miss
Analyst expectations
A$2.70
Pre-results average target from five analysts. Consensus: Buy, but the split is wide at three Buy and two Sell ratings.
High A$5.00Low A$1.60Canaccord A$2.804 Aug snapshot
Signals to watch
Gross margin recovery, second-half EBITDA, delivery timing and recurring revenue. Governance remains material while ASIC examines historical disclosures and trading.
15.7% short interestInventoryProduct mixASIC
Sources: DroneShield first-half 2026 results and investor relations; Visible Alpha consensus via Capital Brief; market and analyst data from Investing.com and S&P Global. Market figures timestamped 26 Aug 2026, 16:12 AEST. Calculations are estimates using reported shares outstanding.
A record quarter matters. The larger signal is a $410 million revenue guide that sits 14% above consensus, supported by 91% data-center growth and expanding margins.
NASDAQ: SMTCUpdated August 26, 2026, 06:32 EDT
Premarket price
$133.00
August 26, 2026, 06:30 EDT
Premarket move
+4.30%
+$5.48 vs August 25 close
Two-session move
+10.00%
$120.91 to $133.00; August 24–26
Implied equity value
$12.39B
Calculated at $133.00; 06:30 EDT
Price reaction
$134$127$120$120.91$127.52$133.00
Aug. 24 closeAug. 25 closeAug. 26, 06:30 EDT
The premarket rise added about $510 million after a $616 million regular-session gain. August 25 regular volume was at least 6.67 million shares, about twice the three-month average.
Q2 FY2027 scorecard
Metric
Reported
Comparison
Revenue
$341.9M
+33% YoY; 4.0% beat
Adjusted EPS
$0.71
+73% YoY; 16.4% beat
Adjusted gross margin
54.5%
+130 bps QoQ
Adjusted operating margin
24.4%
+560 bps YoY
Free cash flow
$61.4M
+48% YoY
Quarter ended July 26, 2026; reported August 25.
Revenue engines
Semiconductors
$243.5M
Infrastructure
$124.0M
Data center
$100.0M
IoT systems
$98.3M
LoRa-enabled
$58.0M
Engine
YoY growth
Data center
+91%
Infrastructure
+69%
LoRa-enabled
+58%
IoT Systems and Connectivity
+11%
Q2 FY2027 revenue; categories overlap and should not be summed.
Margin bridge
Measure
Q2 FY2026
Q1 FY2027
Q2 FY2027
Q3 guide
Adjusted gross margin
53.2%
53.0%
54.5%
58.3% ±100 bps
Adjusted operating margin
18.8%
20.4%
24.4%
≈31.0% midpoint calculation
Adjusted gross margin excluding held-for-sale unit
—
—
—
63.9% ±100 bps
The held-for-sale cellular-module business generated $48.1 million of Q2 revenue and $10.9 million of adjusted gross profit. Its implied 22.7% margin diluted the consolidated profile.
Company results and calculations published August 25, 2026.
Analyst expectations
ConsensusStrong Buy
Strong Buy / Buy / Hold12 / 1 / 2
Average target$202.92
Target range$155–$230
Upside from $13352.6%
15 analyst ratings available August 26, 2026; upside calculated at 06:30 EDT.
What changes the thesis
Upside triggerBacklog converts near $410M
Upside triggerData-center growth stays above 70%
Downside triggerBookings slip before shipment
Downside triggerGross margin misses 57.3%
Execution riskDivestiture or supply delays
Scenario markers, not company forecasts.
Why the stock is up
Semtech beat the completed quarter, but the forward numbers moved the valuation. The $410 million revenue midpoint stands 14% above consensus. The $1.05 adjusted-EPS midpoint is 44% higher. Data-center revenue growth and the planned removal of a low-margin unit make the margin expansion measurable.
Risk lens
Premarket liquidity remains thin. The forecast depends on bookings becoming shipments on schedule. Hyperscaler demand, customer concentration and limited supplier capacity can move timing between quarters. A high-growth valuation also leaves less room for execution errors.
Shares of USA Rare Earth rose further in premarket trading on Wednesday. The company secured funding for a government-supported entity set to purchase all…
·3 min read
NASDAQ: USAR · COMPANY · STOCK MOVE
USA Rare Earth: the funding is real, but it is not corporate cash
The $1.55 billion SPV supports Serra Verde’s output. Friday’s vote tests whether that protection offsets dilution.
U.S. premarketMarket data: Aug. 26, 2026, 06:01 EDT Cash close: Aug. 25, 16:00 EDT
Premarket
$19.90
+2.52% at 06:01 EDT
Tuesday close
$19.41
+6.12% · +$1.12
Two-step value gain
≈$394M
Close move + premarket
Volume
13.49M
1.01× 13.32M average
Market value
$4.75B
At Aug. 25 close
Eight-session price path
Daily closes through Aug. 25, plus the Aug. 26 premarket quote. U.S. dollars.
What moved: Tuesday’s $1.12 gain added about $274 million. The $0.49 premarket rise added another $120 million, using 244.7 million shares outstanding.
Hard catalyst clock
The financing announcement leads directly into the vote.
The SPV completed a $1.55 billion capitalization package for 100% of Serra Verde’s Phase 1 production.
USAR rose 6.12%. Northland maintained Buy and a $45 target.
Stockholders vote on issuing the shares needed for the Serra Verde acquisition.
Management expects closing after remaining conditions are satisfied or waived.
NEXT TEST
Approval removes one hurdle. It does not by itself confirm closing, integration, output or cash generation.
$1.55 billion offtake funding stack
Share of USAR’s $4.75 billion market value at the Aug. 25 close.
DoW investment
$750M
Bank facility
$500M
Forward purchase
≥$300M
Total / market value32.6%
DoW increase+$250M
Offtake coverage100%Phase 1 output
The SPV buys product. Its funding is not a $1.55 billion deposit into USA Rare Earth’s corporate account.
Acquisition arithmetic
Serra Verde consideration at the $19.90 premarket share price.
New USAR shares126.849M≈$2.52B value
Cash payment$300M
Implied total≈$2.82B
New / current shares51.8%
Seller post-deal stake≈34.1%Before other changes
Price floors15 yearsOfftake term
The funding lowers customer and pricing risk. The stock issuance transfers a large part of the combined equity to Serra Verde’s owners.
Current financial signals
Quarter ended June 30, 2026.
Metric
Reading
Investor use
Cash
$1.53B
32.2% of market value
Q2 revenue
$5.82M
Early commercial base
Q2 gross loss
$1.58M
Costs exceeded product revenue
Q2 operating loss
$46.31M
Build-out spending
H1 operating cash use
$75.32M
Pre-acquisition burn
H1 capex + deposits
$108.39M
Expansion investment
Cash was raised largely through a $1.5 billion PIPE. Serra Verde adds operations, debt and integration costs.
Analyst range
Targets available Aug. 25, 2026; change versus the $19.41 close.
Reference
Target
Implied move
Northland
$45.00
+131.8%
S&P Global high
$45.00
+131.8%
S&P Global average
$37.38
+92.6%
S&P Global low
$30.00
+54.6%
STRONG BUY Eight-analyst S&P Global consensus. Targets are opinions, not forecasts.
Rare-earth peer tape
Aug. 25 cash-session moves; the whole group participated.
Company
Ticker
Move
Critical Metals
CRML
+21.44%
USA Rare Earth
USAR
+6.12%
MP Materials
MP
+4.79%
United States Antimony
UAMY
+1.96%
The peer bid matters. USAR’s funding and Friday vote remain company-specific.
Risk monitor
What could break the current valuation case.
The August 28 proposals may fail or closing conditions may remain unresolved.
Issuing 126.849 million shares lifts the current estimated base by 51.8%.
Serra Verde brings Brazilian regulatory, currency, operating and environmental exposure.
Price floors reduce risk but do not guarantee target output or acceptable mine costs.
USA Rare Earth reported a gross loss in Q2 and still consumes operating cash.
A broad reversal in rare-earth equities could overwhelm the company catalyst.
SANTA CLARA, California, August 26, 2026, 04:53 EDT – Shares of AMD climbed 4.9% after the company's server-CPU market forecast increased by $37 billion,…
Raymond James' $201 billion market forecast pushed AMD 4.9% higher. The operating test is whether EPYC share gains sustain Data Center growth and a 56% gross margin.
Market data through August 25, 2026 Close 16:00 EDT · after hours 18:08 EDT Prepared August 26, 2026, 04:57 EDT
Regular close
$479.18
+$22.38 · +4.90%
Market value
$795.0B
≈+$37.1B in one session
Volume
19.0M
August 25 regular session
After hours
$481.66
+0.52% at 18:08 EDT
What moved the stock
$400$460$520$580$640
$456.81Prior close
$479.18Aug. 25 close
$553.72Consensus target
$641Raymond James
Price moveConsensus targetFresh bull target
Q2 revenue mix
Data Center
$6.7B
Client
$3.1B
Embedded
$977M
Gaming
$779M
Data Center generated 58% of AMD's $11.5 billion quarterly revenue. It more than doubled year over year, while Gaming fell 31%.
CPU share: volume versus value
0%10%20%30%40%
33.2%Unit share
46.2%Revenue share
Mercury Research, Q1 2026 x86 server market. Higher revenue share indicates a premium product mix.
Financial signals and expectations
Metric
Latest
Change / benchmark
Reading
Q2 revenue
$11.5B
+50% YoY
Record
Data Center revenue
$6.7B
More than doubled
Core bull case
Q3 revenue guide
$13.0B ± $0.3B
Consensus was $12.52B
Above Street
Q3 adjusted gross margin
56%
Flat with Q2
Scale must offset mix
Trailing P/E
≈123×
Premium valuation
Execution-sensitive
Consensus target
$553.72
+15.6%
Below Raymond James
Why it rose
The upgrade changed the revenue lens. Raymond James expects CPUs, not only AI accelerators, to capture a large share of agentic-AI infrastructure spending. AMD's 46.2% server revenue share gives the forecast an operating bridge.
What confirms it
Sustained EPYC share gains, Data Center growth above company growth, the $13 billion Q3 guide, and a gross margin holding near 56% would support the repricing.
Risks
$201 billion is an analyst estimate, not backlog. Intel, Nvidia and Arm compete for server workloads. Foundry dependence, customer concentration and weak Gaming revenue can pressure margins.
AI Earnings Gains Hold as Overnight Session Advances08/26/2026 · 23:02 EDT U.S. EQUITIES · OVERNIGHT SESSION AI earnings bid holds into the third overnight…
Alibaba Group Holding Limited rose 0.82% on Tuesday. The rebound followed a discounted HK$80 billion share placement for AI investment. The stock closed at…
·2 min read
Alibaba AI Placement Dashboard
NYSE:BABA · Market data through August 25, 2026, 20:00 EDT
Close
$119.44
Daily move
+0.82%
After-hours
$119.25
Volume
15.8M
Market value
$272.4B
New dilution
3.57%
What HK$80 billion must earn
Investor bridge
The issue raises about $10.21 billion for chips, infrastructure and models. That equals 6.6% of trailing revenue and 18.1% of Alibaba's three-year AI plan.
Placement as a share of the $56.54B three-year AI commitment
Placement terms
Measure
Value
New shares
710M
Offer price
HK$112.70
Discount
8.4%
Net cash
HK$79.7B
Expected close
Aug. 26
Cloud return channel
June quarter
Value
Group revenue
$39.6B
Revenue growth
+9%
AI cloud revenue
$7.1B
Cloud growth
+45%
Cloud adj. EBITA
$830M
EBITA growth
+133%
Market expectations
Analysts
Value
Consensus
Strong Buy
Coverage
40
Average target
$186.68
Implied upside
+56.3%
Low / high
$92.74 / $237.81
Price path
Date
Close
Move
Volume
Aug. 20
$130.53
+1.26%
28.1M
Aug. 21
$119.34
−8.57%
32.4M
Aug. 24
$118.47
−0.73%
23.9M
Aug. 25
$119.44
+0.82%
15.8M
The ADR remains 8.5% below its Aug. 20 close.
What can break the thesis
AI infrastructure reaches full utilization too slowly.
Model and cloud pricing fall faster than unit costs.
Depreciation absorbs cloud margin gains.
Export controls restrict access to advanced chips.
Gold touched a three-month high on Tuesday as falling Treasury yields lowered its opportunity cost. The move brought $4,700 into view before profit-taking trimmed…
A three-month high met profit-taking while listed-fund demand accelerated.
Data cut: August 25, 2026, 18:25 EDT U.S. cash markets closed
Spot intraday high
$4,696.18
per troy ounce
Comex August settle
$4,638.10
−0.06% session
10-year Treasury
4.638%
−6.5 bp on day
GLD close
$428.10
+0.33% · 15:59 EDT
August acceleration
$4,800$4,550$4,300$4,050Aug 4Aug 14Aug 25
Most-active futures reference series; closes shown through August 25. The month-to-date move is roughly 14%.
Rate channel
Gold pays no coupon. Lower Treasury yields reduce the income forgone by holding bullion.
10-year daily move
−6.5 bp, the largest decline since June 24.
30-year daily move
−5.6 bp to 5.174%.
Investor activity
Vehicle / flow
Reading
Signal
GLD volume
40.0m shares
2.1× Monday
GLD turnover
≈$17.1bn
High liquidity
GLD creations
$1.2bn
Fresh demand
Metals ETF creations
$1.3bn
GLD share ≈92%
Turnover is price multiplied by volume; creations are reported primary-market flows.
Cross-market check
Asset
August 25
Read-through
Spot gold
High $4,696.18
Safe-haven bid
Silver
$68.86
Near-flat
U.S. 10-year
4.638%
Lower carry hurdle
Dollar index
Broadly steady
Yield move dominated
China net imports
56.193 tonnes
+11% in July
What happens next
Wed 26
July PCE inflation Goldman Sachs estimates core PCE at +0.23% month over month. A hotter print can lift yields and pressure bullion.
Fri 28
Kevin Warsh at Jackson Hole The Fed chair's policy tone can reset rate expectations and the dollar.
Sep 9
Expanded Treasury buybacks Execution will test whether long-end liquidity support keeps yields contained.
Scenario map
Trigger
Likely gold pressure
Softer PCE, lower yields
Supportive
Hotter PCE, stronger dollar
Negative
Persistent ETF creations
Supportive
Geopolitical easing
Negative
Bottom line
The breakout case now needs confirmation from rates and fund flows. A clean hold above $4,700 would extend August's trend. A reversal in yields would expose a crowded trade after a 14%-plus monthly gain.
Shares of NuScale Power Corporation surged 9.78% to close at $9.94 on Tuesday, boosting its market capitalization by approximately $379 million.
·3 min read
NuScale Power · NYSE: SMR
Nuclear AI meets a pre-revenue valuation
Market snapshot: August 25, 2026, 14:21 EDT · Regular session
$9.94+9.78% · +$0.89
$4.26B
Market capitalization
36.60M
Volume · 1.17× average
≈$379M
Value added in the session
Up to 80%
Faster information retrieval in proof of concept
Price position
The shares remain 82.7% below their $57.42 high. The 13-analyst average target implies 19.2% upside.
What changed
Fresh catalyst
NuScale deployed Nuclearn AtomAssist and NPX across engineering and knowledge management.
Proof-of-concept search-time reduction: up to 80%.
No customer contract, order value, revenue or savings target was disclosed.
Valuation versus operating scale
Signal
Value
Investor read
Q2 revenue
$75K
≈99% below estimate
Session value gain
≈$379M
>5,000× Q2 revenue
Liquidity
$1.9B
44.6% of market cap
ATM authorization
Up to $750M
17.6% of market cap
Module output
77 MWe
Up to 924 MWe for 12 modules
Analyst spread
Reference
Target
Cantor · Buy
$20.00
Texas Capital · Buy
$12.00
RBC · Hold
$10.00
Citi · Sell
$6.50
Consensus: 5 Buy, 7 Hold, 1 Sell.
Catalyst timeline
August 5Q2 revenue of $75K; liquidity reached $1.9B.
August 11Up to $750M at-the-market program registered.
August 20Texas Capital set a $12 Buy target.
August 25Nuclear-specific AI deployment announced; shares gained 9.78%.
Risk monitor
Internal efficiency is not the same as customer revenue. The proof-of-concept result may not translate into lower project costs. Licensing, financing, manufacturing readiness and binding customer commitments remain the larger valuation tests. Sector-wide strength also amplified Tuesday's move: Oklo rose 12.8% and Nano Nuclear Energy gained 6.4% in the same snapshot.
Sources: NuScale Power releases dated August 5 and August 25, 2026; SEC filing dated August 11, 2026; Google Finance market and analyst data captured August 25, 2026, 14:21 EDT. Calculations use displayed figures and may differ because of rounding.
The chart uses verified closes through Aug. 21 and the Aug. 25 intraday snapshot. The stock remains about 26% above its July 31 close despite Tuesday's drop.
Upcoming catalyst
Wells Fargo raises target to $120 and keeps Overweight.
Fiscal Q2 results after the close.
Management conference call and webcast.
High expectationsRegular session
Operating scorecard
Metric
Latest / guide
Signal
Q1 revenue
$387.1M; +39% YoY
Growth
Q1 subscription ARR
$1.57B; +32% YoY
Core demand
Q1 free cash flow
$73.6M; 19% margin
Leverage
Q2 revenue guide
$395M–$397M
+27.7% YoY at midpoint
Q2 adjusted EPS guide
$0.03–$0.05
Profitable
FY27 revenue guide
$1.638B–$1.648B
Valuation base
FY27 free-cash-flow guide
$293M–$303M
≈18.1% midpoint margin
Valuation hurdle
Price / FY27 revenue guide midpoint
≈11.4×
Consensus target
$103.07 · 13.3% upside
Target range
$85–$135
At the intraday price, the low target implies 6.6% downside and the high target 48.4% upside.
Analyst comparison
Firm / sample
Rating
Target
Implied move
Wells Fargo
Overweight
$120
+31.9%
Oppenheimer
Outperform
$120
+31.9%
Cantor Fitzgerald
Overweight
$120
+31.9%
KeyBanc
Overweight
$112
+23.1%
27-analyst consensus
Strong Buy
$103.07
+13.3%
What can break the setup
ARR growth below expectations, cautious forward guidance, or heavier investment could compress the revenue multiple. The stock's August rally also raises the threshold for a favorable post-earnings reaction.
Sources: Rubrik investor relations, Yahoo Finance, Wells Fargo research summary, S&P Global analyst compilation and company guidance. Time-sensitive market figures are stamped August 25, 2026, 14:33 EDT.




![Asia Stock Market Today 27/08/2026 [UPDATE: 23:57 SGT] [Salesforce and Nvidia Lead KASE Global as Asia Closes Mixed]](https://ts2.tech/wp-content/uploads/2026/08/Asia-market-dashboard-2026-08-27-2355-1024x683.jpg "Asia Stock Market Today 27/08/2026 [UPDATE: 23:57 SGT] [Salesforce and Nvidia Lead KASE Global as Asia Closes Mixed]")
![UK Stock Market Today 26/08/2026 [UPDATE: 15:51 BST] [Hot PCE Tests FTSE Recovery as Miners Offset Oil Drag]](https://ts2.tech/wp-content/uploads/2026/08/UK-market-dashboard-2026-08-26-1551-1024x683.jpg "UK Stock Market Today 26/08/2026 [UPDATE: 15:51 BST] [Hot PCE Tests FTSE Recovery as Miners Offset Oil Drag]")
![US Stock Market Today 08/26/2026 [UPDATE: 23:02 EDT] [AI Earnings Gains Hold as Overnight Session Advances]](https://ts2.tech/wp-content/uploads/2026/08/US-market-dashboard-2026-08-26-2300-1024x683.jpg "US Stock Market Today 08/26/2026 [UPDATE: 23:02 EDT] [AI Earnings Gains Hold as Overnight Session Advances]")
![Australia Stock Market Today 26/08/2026 [UPDATE: 14:42 AEST] [ASX Stabilises Near Session Low as CPI Hike Risk Lingers]](https://ts2.tech/wp-content/uploads/2026/08/AU-market-dashboard-2026-08-26-1442-1024x683.jpg "Australia Stock Market Today 26/08/2026 [UPDATE: 14:42 AEST] [ASX Stabilises Near Session Low as CPI Hike Risk Lingers]")

![Asia Stock Market Today 26/08/2026 [UPDATE: 23:09 SGT] [KASE Global Trades as Hot PCE Tests Asia’s Chip Rally]](https://ts2.tech/wp-content/uploads/2026/08/Asia-market-dashboard-2026-08-26-2307-1024x683.jpg "Asia Stock Market Today 26/08/2026 [UPDATE: 23:09 SGT] [KASE Global Trades as Hot PCE Tests Asia’s Chip Rally]")