
SAN JOSE, California, August 21, 2026, 04:36 PDT — U.S. cash markets remained shut as premarket activity continued.
- BILL bought back 8.4 million shares during fiscal Q4, spending roughly $300 million.
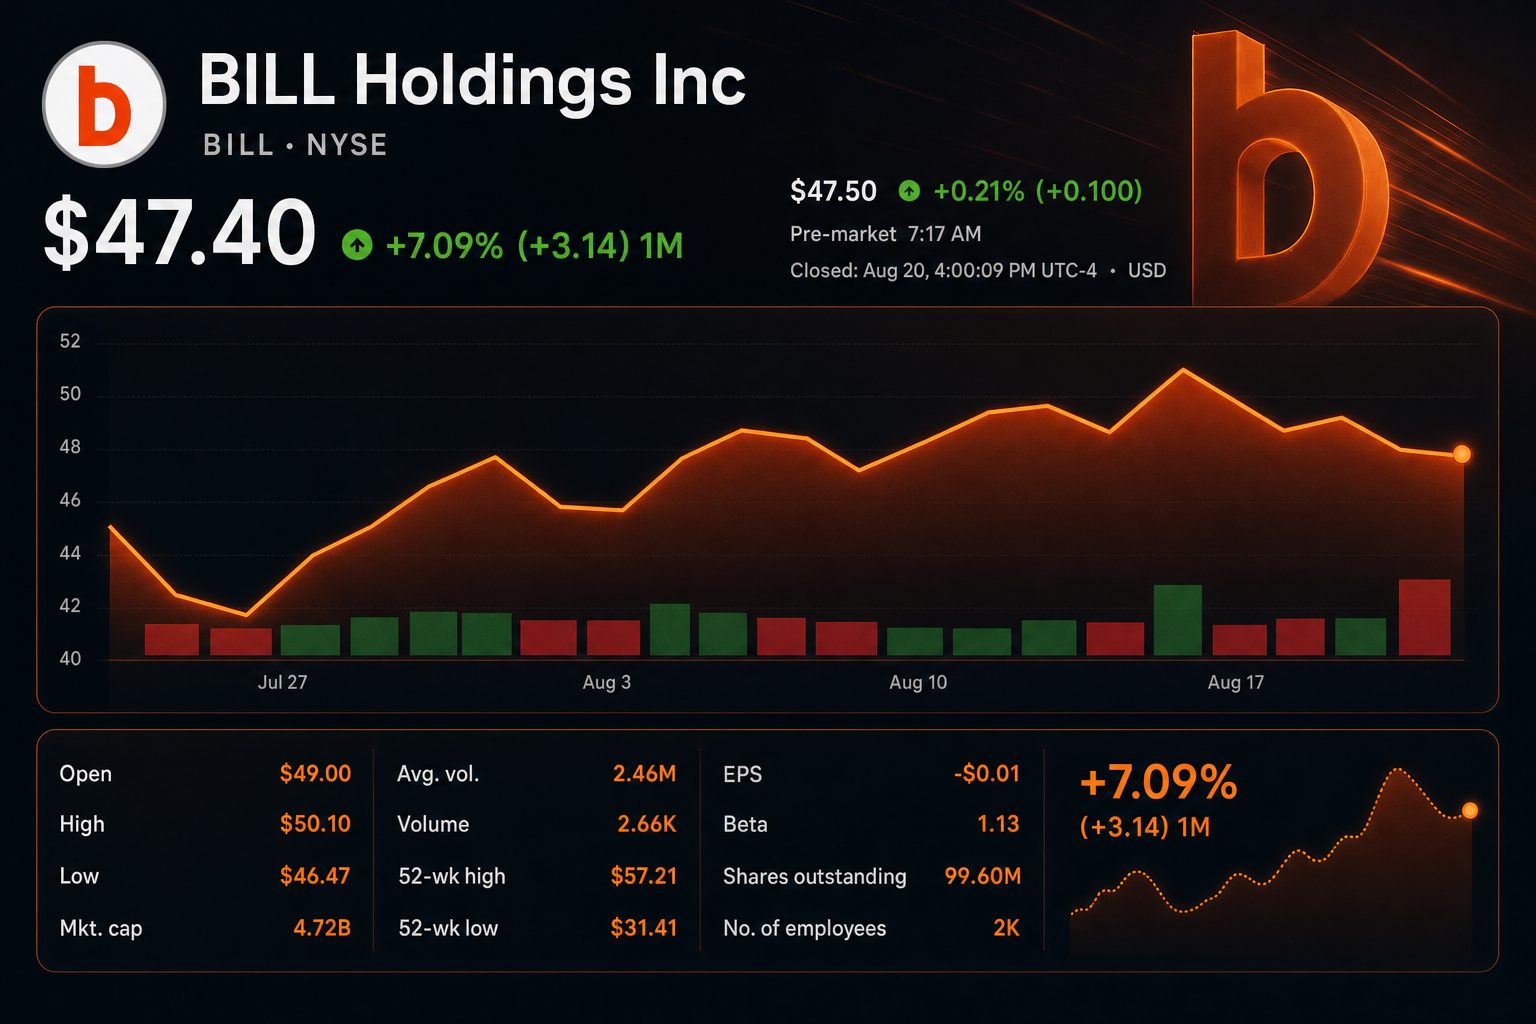
- The implied average purchase price of $35.71 is 24.7% lower than Thursday’s closing level of $47.40.
- Guidance for core revenue growth in fiscal 2027 eases to 11%–14%, compared to 16% in fiscal 2026.
BILL Holdings, Inc. NYSE:BILL repurchased approximately 8.4 million shares in the previous quarter at an implied average price of $35.71. The stock finished at $47.40 on Thursday, representing a 32.7% increase from the buyback price, putting the company’s recent repurchase in substantial unrealized profit.
The buyback is significant as growth is expected to slow. BILL forecasted core revenue for fiscal 2027 at $1.669 billion to $1.719 billion. The midpoint reflects a 12.6% increase, compared with 16% in the prior year.
| Buyback measure | Value | Investor read-through |
|---|---|---|
| Fiscal Q4 repurchase | About $300 million | Significant activity within a single quarter |
| Shares repurchased | About 8.4 million | Represents 8.4% of current shares outstanding |
| Implied average cost | $35.71 | Based on spending disclosed and repurchased shares |
| Aug. 20 close | $47.40 | 32.7% higher than implied average cost |
| After-hours price | $47.60 | 0.42% higher than the closing price |
The quarterly performance exceeded the implication of the stock movement. Revenue increased by 14% to $436.2 million. Core revenue advanced 16% to $400.5 million, driven by a 17% rise in transaction fees.
| Fiscal Q4 measure | 2026 | 2025 | Change |
|---|---|---|---|
| Total revenue | $436.2 million | $383.3 million | up 14% |
| Core revenue | $400.5 million | $345.9 million | rose 16% |
| GAAP gross margin | 81.7% | 80.8% | improved 90 basis points |
| Non-GAAP operating income | $101.6 million | $56.4 million | up 80% |
| GAAP net income (loss) | ($18.5 million) | ($7.1 million) | Loss increased |
Profit quality is still uneven. Non-GAAP operating income rose 80%, while the GAAP loss increased further. Stock-based pay, restructuring, and additional excluded expenses continue to drive the gap between the two figures.
Payment volumes remained resilient despite a decline in customer numbers. The total payment volume was $98 billion with 37 million transactions recorded. The number of businesses utilizing BILL solutions dropped to 479,300 from 493,800 year-on-year.
| Operating measure | June 2026 | June 2025 | Change |
|---|---|---|---|
| Businesses with active solutions | 479,300 | 493,800 | -2.9% |
| Quarterly payments processed | $98 billion | About $86 billion | +14% |
| Quarterly transaction count | 37 million | About 32.5 million | +14% |
| Independent network users | 9.2 million | About 8.3 million | +11% |
The division lies at the heart of how investors judge the company. BILL is handling a higher payment volume for every solution relationship it reports. However, a decreasing number of customers makes retaining clients and driving cross-selling more challenging.
| Fiscal 2027 outlook | Guidance | Midpoint | Versus fiscal 2026 |
|---|---|---|---|
| Total revenue | $1.807 billion–$1.857 billion | $1.832 billion | up 10.8% |
| Core revenue | $1.669 billion–$1.719 billion | $1.694 billion | up 12.6% |
| Non-GAAP operating income | $421 million–$451 million | $436 million | up 34.7% |
| Non-GAAP diluted EPS | $3.56–$3.79 | $3.68 | up 32.7% at midpoint |
Executives are requesting that shareholders tolerate reduced sales growth in exchange for significantly accelerated adjusted profit increases. Chief Financial Officer Rohini Jain stated “growth and margin expansion are not a trade-off at BILL.” BILL
A shift in reporting will increase complexity. From next quarter onward, rewards expense will be deducted from revenue instead of being subtracted from sales and marketing expenses. BILL’s stated guidance reflects the figures prior to this deduction, and includes a projected $401.5 million in rewards expense for fiscal 2027.
Wall Street maintained a positive outlook. According to Google Finance, there were nine Buys and six Holds. The consensus price target stood at $55.23, representing a 16.5% premium to Thursday’s closing price.
| Analyst | Firm | Recommendation | Target | Date |
|---|---|---|---|---|
| Scott Berg | Needham | Buy | $75 | Aug. 20 |
| Taylor McGinnis | UBS | Buy | $60 | Aug. 20 |
| Andrew Harte | BTIG | Buy | $60 | Aug. 20 |
| Kenneth Wong | Oppenheimer | Buy | $55 | Aug. 20 |
| Daniel Jester | BMO Capital | Hold | $55 | Aug. 20 |
| Sanjay Sakhrani | KBW | Hold | $54 | Aug. 20 |
| Siti Panigrahi | Mizuho | Hold | $43 | Aug. 20 |
BTIG’s Andrew Harte described the core-revenue guidance as showing “a measure of prudence.” As a result, progress in customer stabilization stands out as the stronger positive indicator rather than an additional adjusted earnings outperformance. BTIG comments reported by Investing.com
BILL ended 0.65% lower at $47.40 on August 20. Google Finance showed this price at 16:00:09 EDT, while after-market trading brought shares to $47.60. The stock continues to trade beneath its 52-week peak of $57.21.
The upcoming earnings report will indicate if platform selling drives an increase in customer numbers. It will also provide investors with their initial unclouded look at the updated rewards structure. At present, the buyback acts as a reference point for valuation. Sustained growth will depend on execution.
Risks: The implied average of the repurchase price does not serve as a guaranteed minimum. Comparing performance may be challenging due to rewards accounting. Reduced spending by small businesses, credit losses, fraud, less customer retention, or weaker interchange economics may negatively impact revenue and margins.
Related articles: Earnings