
NEW YORK, August 7, 2026, 15:07 EDT — U.S. markets open
- Blue Owl gained 3.2% to $11.83, beating the performance of major alternative-asset rivals.
- Blue Owl estimates that undeployed assets have the potential to generate $380 million in yearly management fees.
- An initial estimate indicates the fees may contribute about $0.12 per share to annual distributable earnings.
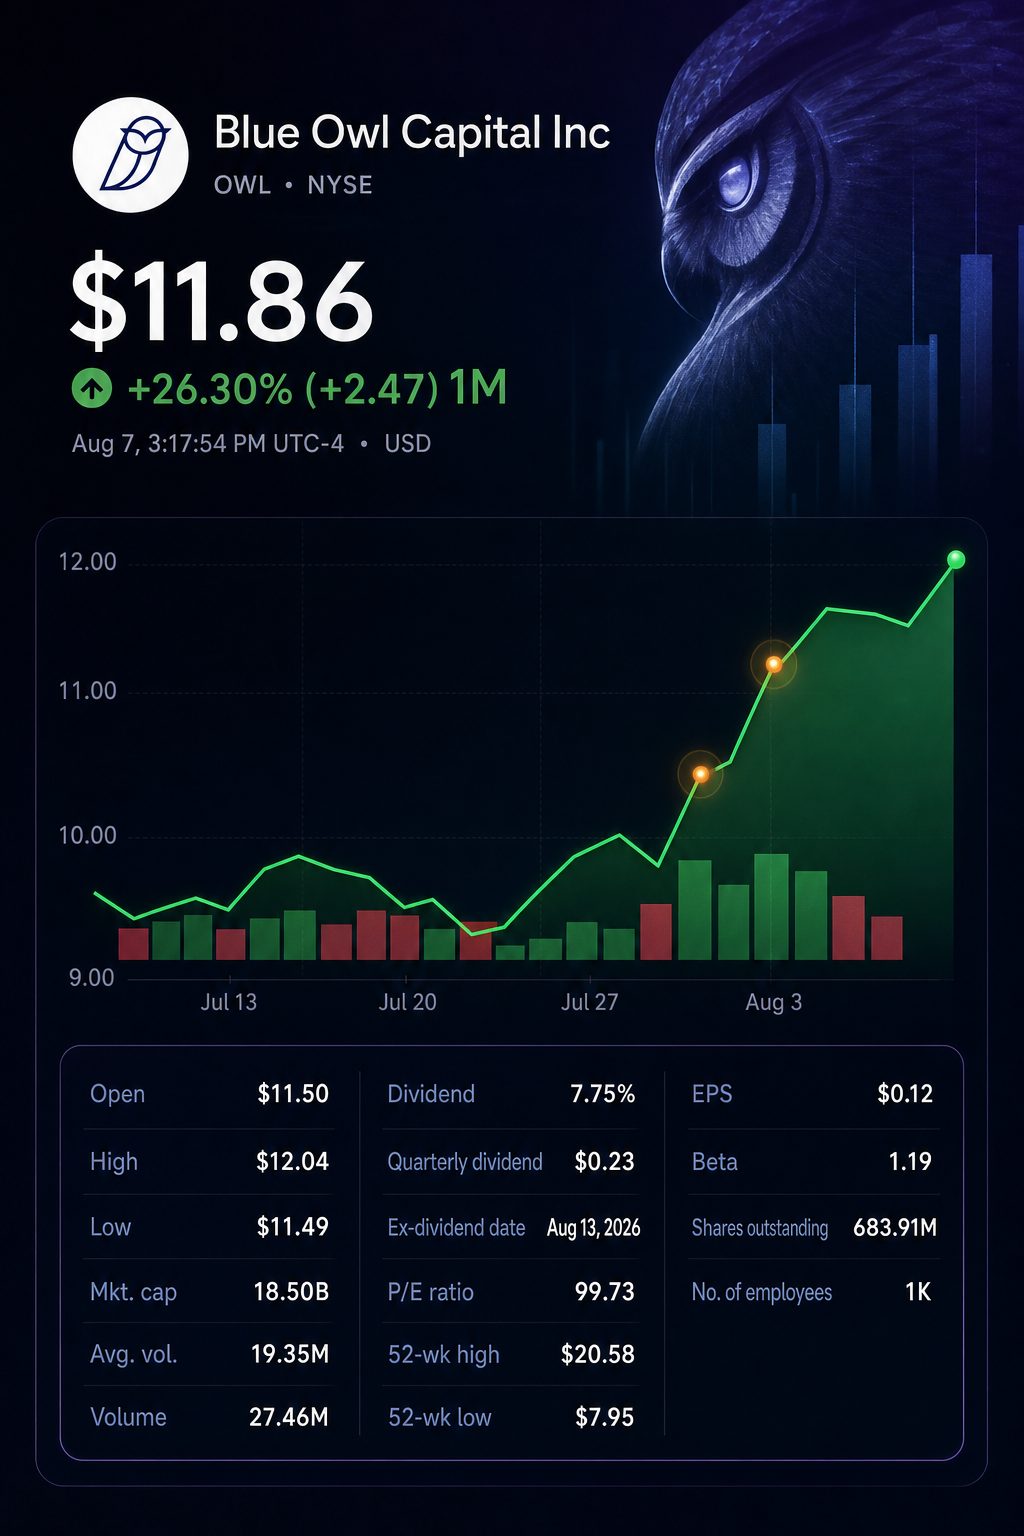
Shares of Blue Owl Capital Inc. NYSE:OWL climbed 3.2% to $11.83 on Friday, outpacing other large alternative-asset managers ahead of the close.
The rally intensifies investors’ key concern. Blue Owl’s quarterly dividend of $0.23 remains above its most recent distributable earnings, which stand at $0.22 per share.
The company still holds $31.1 billion in assets that are not currently generating fees. Management anticipates these assets will bring in approximately $380 million each year once allocated. This potential revenue could help close the payout gap.
Friday market overview
| Company | Price | Friday move |
|---|---|---|
| Blue Owl Capital NYSE:OWL | $11.83 | up 3.23% |
| Blackstone Inc. NYSE:BX | $137.32 | up 2.90% |
| Apollo Global Management Inc. NYSE:APO | $128.26 | up 0.21% |
| KKR & Co. Inc. NYSE:KKR | $103.40 | up 0.05% |
| Ares Management Corp. NYSE:ARES | $137.67 | down 0.36% |
Prices represent trades recorded at approximately 14:51 EDT.
Blue Owl offered an annualized dividend yield of roughly 7.8% based on Friday’s closing price. The stock reached $12.02 at its session peak.
Blue Owl performance comparison
| Metric | Q2 2026 | Q2 2025 | Change |
|---|---|---|---|
| Assets under management | $319.0 billion | $284.1 billion | +12% |
| Fee-paying AUM | $190.6 billion | $177.5 billion | +7% |
| FRE management fees | $672.6 million | $620.2 million | +8% |
| Fee-related earnings | $392.2 million | $358.3 million | +9% |
| FRE margin | 58.5% | 57.0% | up 1.5 percentage points |
| Distributable earnings | $351.2 million | $323.0 million | +9% |
| Distributable earnings per share | $0.22 | $0.21 | increase of $0.01 |
The firm discloses fee-related earnings and distributable earnings as non-GAAP metrics.
Blue Owl reported approximately $0.87 in distributable earnings per share over the most recent four quarters. The annual dividend stands at $0.92 per share, indicating a trailing coverage ratio of about 95%.
A provisional calculation offers investors a more transparent view of potential gains. Using Blue Owl’s Q2 margin and earnings conversion rate to the $380 million fee pipeline yields roughly $0.12 in annual distributable earnings per share. This figure is approximately 2.4 times greater than the most recent $0.05 payout shortfall.
The projection is based on complete rollout, steady fee rates, and constant margins. Deployment will be phased. Actual product economics will vary.
Comparing platforms
| Platform | AUM | AUM growth | Q2 equity raised | AUM not yet paying fees | Expected annual fees |
|---|---|---|---|---|---|
| Credit | $158.1 billion | +9% | $1.8 billion | $17.5 billion | $229 million |
| Real Assets | $89.4 billion | +25% | $4.4 billion | $12.8 billion | $141 million |
| GP Strategic Capital | $71.5 billion | +7% | $1.3 billion | $0.8 billion | $10 million |
| Total | $319.0 billion | +12% | $7.6 billion | $31.1 billion | $380 million |
Blue Owl rounds platform figures, so totals may not add up.
Real Assets accounted for roughly 58% of equity raised during the quarter, while making up just 28% of overall AUM. This change lessens Blue Owl’s reliance on direct lending.
The company underscored that trend on Tuesday, finalising a €1.6 billion European net-lease fund, surpassing its €1 billion goal. Marc Zahr, Blue Owl’s global head of Real Assets, described Europe as “the next frontier for institutional sale-leasebacks.” Blue Owl Capital
The latest results from Blue Owl’s public lending vehicles sent a mixed message on credit performance. Earnings climbed, and fair-value non-accruals remained minimal. However, cost-basis non-accruals increased.
New comparison of Blue Owl credit vehicles
| Metric | Blue Owl Capital Corporation NYSE:OBDC | Blue Owl Technology Finance Corp. (NYSE:OTF) |
|---|---|---|
| Portfolio measured at fair value | $15.0 billion | $14.7 billion |
| NAV per share | $14.26 | $16.48 |
| NAV movement for the quarter | -1.0% | -0.1% |
| Adjusted net investment income per share | $0.34 | $0.30 |
| Non-accruals based on fair value | 0.8% | 0.1% |
| Non-accruals by cost | 2.8% | 0.6% |
| Net debt to equity | 1.11 times | 0.93 times |
Results for both vehicles were released on August 5.
The outlook is not entirely positive. OBDC saw its fair-value non-accrual rate drop from 1.0%, while its cost rate increased from 2.0%. OTF’s cost rate rose to 0.6% from 0.3%; its fair-value non-accruals stayed at 0.1%.
Analyst updates following earnings remain mixed. Goldman Sachs and Barclays increased their price targets, although both remain under Friday’s closing price. BMO’s updated target suggests limited short-term gains.
Analysts’ ratings
| Research firm and analyst | Latest action | Rating | Target | Versus $11.83 |
|---|---|---|---|---|
| Goldman Sachs Group NYSE:GS, Alexander Blostein | Aug. 3: increased from $9.50 | Neutral | $10.50 | -11.2% |
| BMO Capital Markets, Bank of Montreal TSE:BMO, Brennan Hawken | Aug. 3: upgraded from $11 | Outperform | $12.00 | +1.4% |
| Barclays PLC LON:BARC, Benjamin Budish | July 31: revised up from $9 | Equal Weight | $10.00 | -15.5% |
| Oppenheimer Holdings (NYSE:OPY), Chris Kotowski | July 17: lowered from $16 | Outperform | $15.00 | +26.8% |
| Citizens JMP, Citizens Financial Group NYSE:CFG, Brian McKenna | July 9: reduced from $21 | Market Outperform | $17.00 | +43.7% |
| 16-analyst consensus | Current | Moderate Buy | $13.44 | +13.6% |
The consensus includes eight holds and eight buys, with one rated as a strong buy. Price targets span from $9.10 to $20.
Risks: The fee bridge relies on prompt deployment and maintaining steady margins. Credit continues to account for 50% of AUM and nearly 60% of expected new fees. During the second quarter, investors sought $4.7 billion in redemptions from two main private-credit funds.
Blue Owl shares will trade ex-dividend on August 13, with the $0.23 dividend due to be paid on August 27. Despite gains on Friday, the stock was still down roughly 42% from its 52-week peak of $20.58.