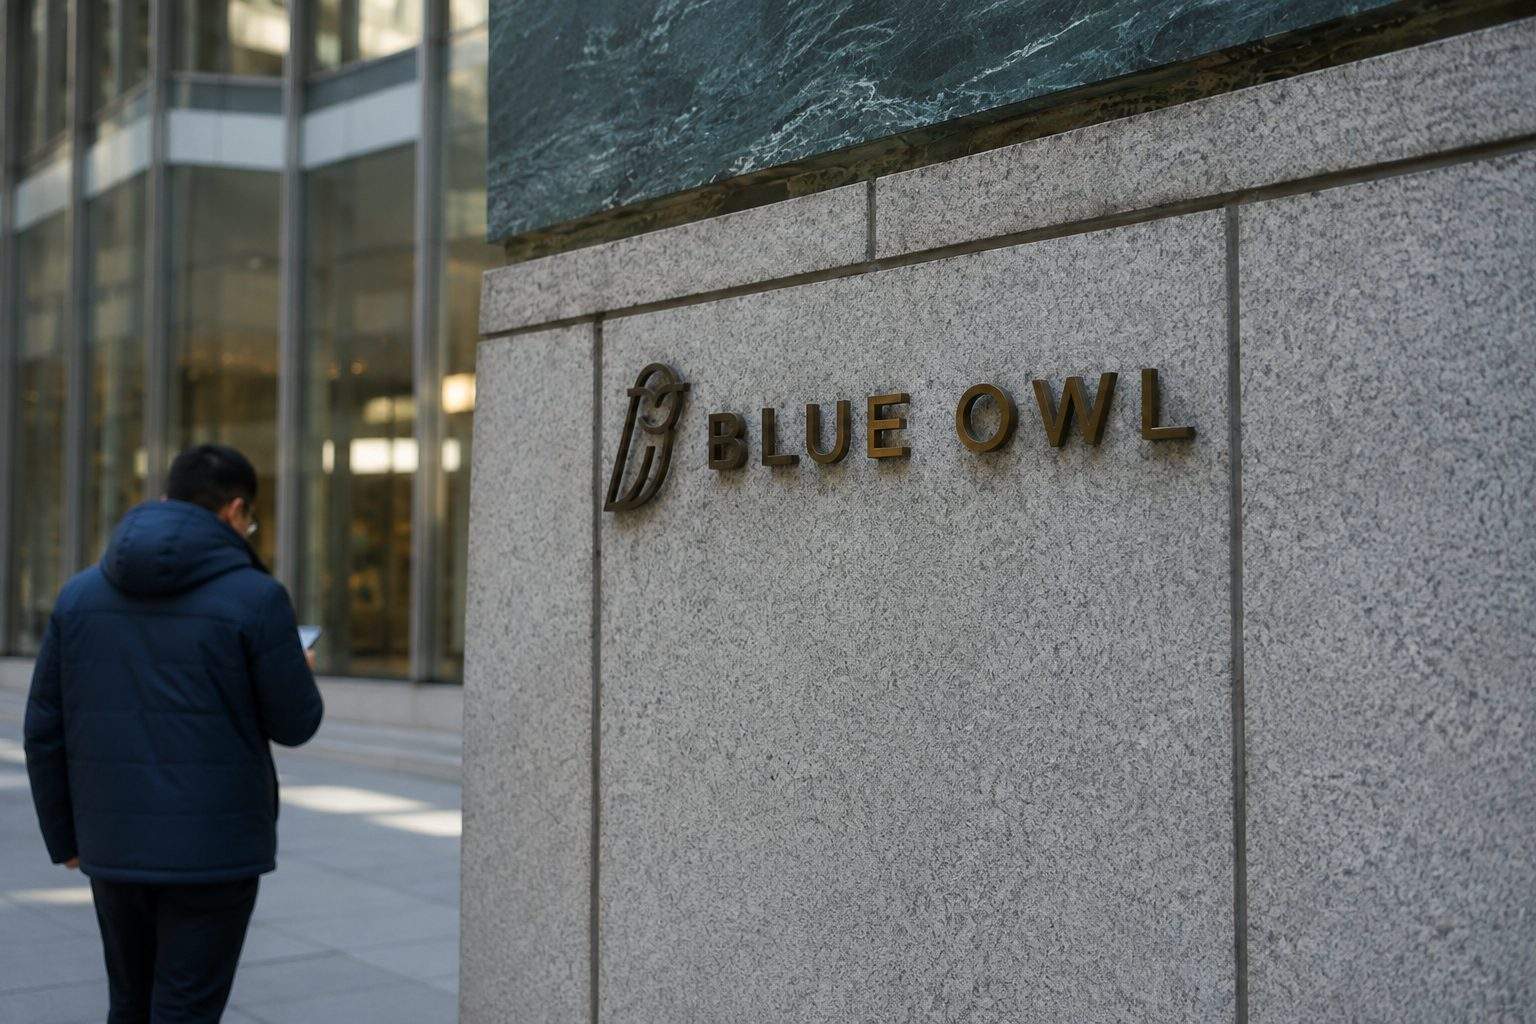

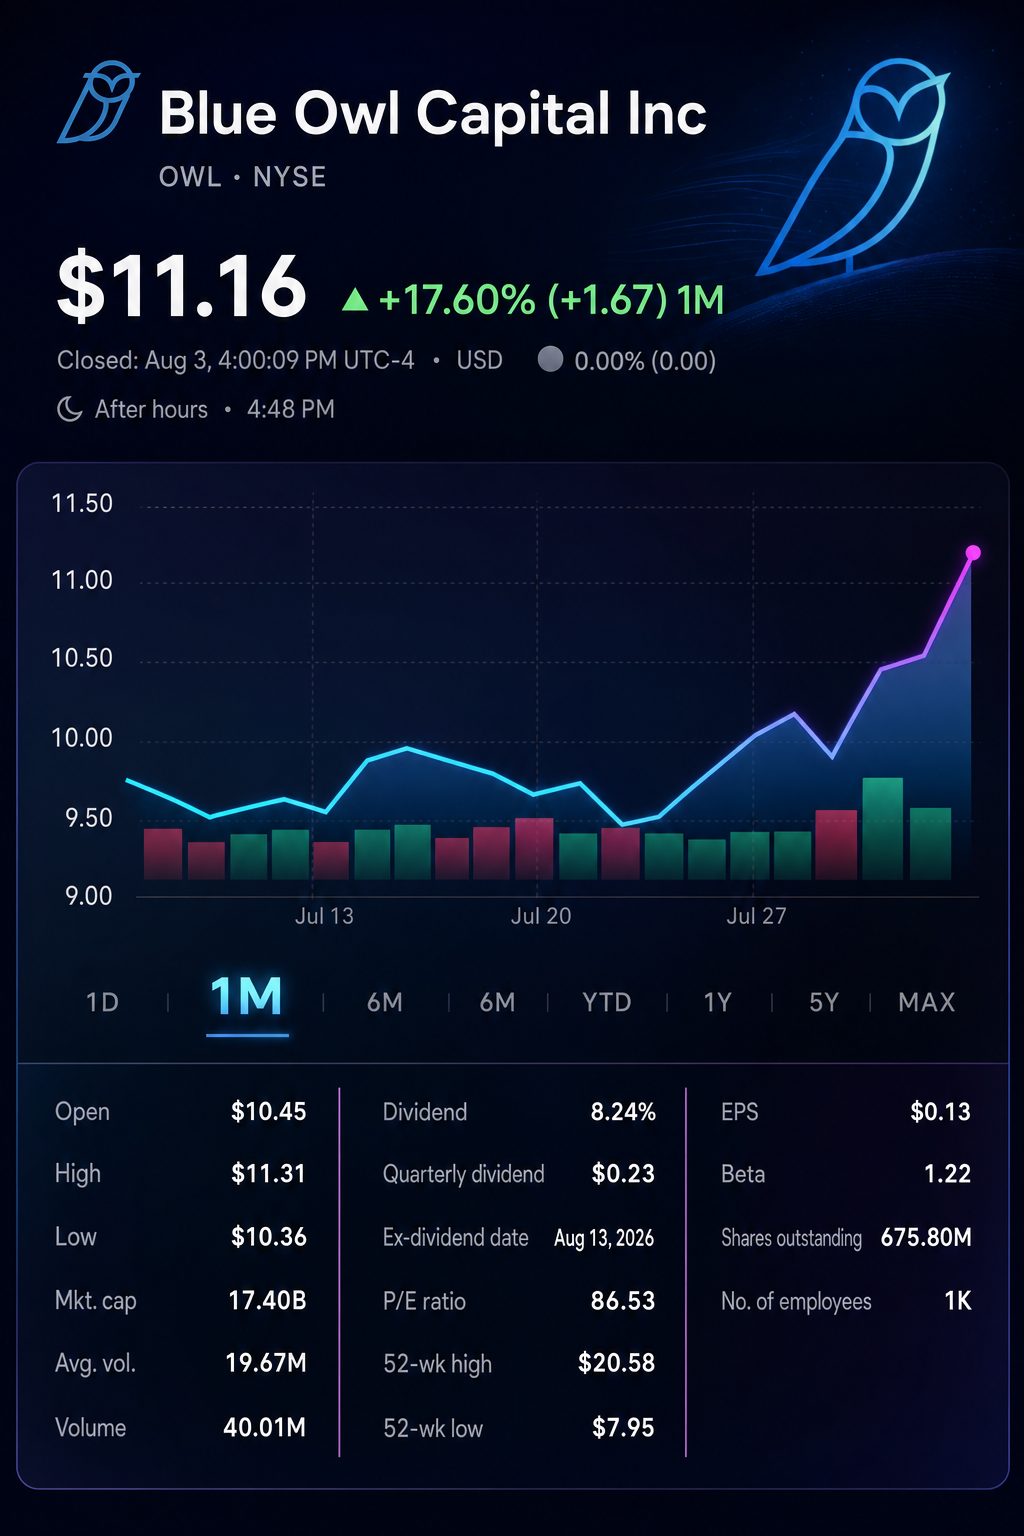
NEW YORK, August 3, 2026, 16:59 EDT — Blue Owl Capital NYSE:OWL climbed 8%, supported by real assets growth that lifted second-quarter fundraising.
- Shares finished the session at $11.16, rising 8.35%, following a 9.0% advance in the previous week.
- Real assets accounted for 59% of equity fundraising in the second quarter, despite representing 28% of assets under management.
- Initial estimate: Assets not yet deployed may contribute approximately $380 million to yearly management fees.
Shares in Blue Owl climbed 8.35% on Monday, building on their gains from the week before. The U.S. cash market remained shut, while after-hours trading continued. Trading volume totaled 40.0 million shares.
The focus for investors now shifts to the composition of the business. In the second quarter, real assets gathered $4.45 billion in equity. Meanwhile, credit attracted just $1.76 billion.
Real assets accounted for 58.9% of fundraising, representing 28.0% of assets under management. This reflects a ratio 2.1 times higher than the platform’s current asset allocation. In comparison, credit posted a similar ratio of only 0.47 times.
Monday’s action came as the sector benefited from broader positive momentum. All major publicly traded alternative managers posted gains. The S&P 500 climbed 1.48%, indicating that macro factors contributed to Blue Owl’s increase.
| Monday close | Price | Daily change |
|---|---|---|
| Blue Owl Capital | $11.16 | +8.35% |
| Ares Management NYSE:ARES | $138.57 | +8.15% |
| Blackstone NYSE:BX | $134.68 | +5.42% |
| KKR NYSE:KKR | $106.56 | +5.07% |
| Apollo Global Management NYSE:APO | $129.42 | +3.13% |
| S&P 500 | 7,600.50 | +1.48% |
Blue Owl continued to outperform most of its competitors, rising 9.0% between July 27 and 31. Between July 24 and Monday, its rebound totaled 18.1%.
Blue Owl’s fee economics remained resilient even as fundraising slowed. The company describes its latest quarterly numbers as preliminary and unaudited.
| Q2 operating metric | 2026 | 2025 | Change |
|---|---|---|---|
| Total assets under management | $319.0 bln | $284.1 bln | +12% |
| Management fees from FRE | $672.6 mln | $620.2 mln | +8% |
| Fee-related profit | $392.2 mln | $358.3 mln | +9% |
| Distributable profit | $351.2 mln | $323.0 mln | +9% |
| GAAP net profit attributable to Blue Owl | $11.4 mln | $17.4 mln | -35% |
The split contributed to the market’s reaction. Recurring fee metrics increased, but GAAP profit dropped significantly. The quarterly dividend stayed at $0.23 per Class A share.
Deployment is the biggest embedded lever. Blue Owl reported $31.1 billion in AUM that has not started generating fees. Management expects this to produce around $380 million in yearly fees after it is deployed. That represents approximately 14% of recent FRE management fees. This is not recognized as revenue.
The most pronounced shift can be seen in capital allocation. The following ratios are based on company data.
| Platform | Q2 equity raised | Fundraising share | AUM share | Fundraising intensity |
|---|---|---|---|---|
| Credit | $1.76 bln | 23.4% | 49.6% | 0.47x |
| Real Assets | $4.45 bln | 58.9% | 28.0% | 2.10x |
| GP Strategic Capital | $1.34 bln | 17.7% | 22.4% | 0.79x |
Fundraising proportion as a fraction of AUM proportion.
The difference compared to Ares is pronounced. Ares posted $36.4 billion in fundraising for the quarter, with $23.7 billion attributed to credit. Blue Owl, by comparison, brought in $1.8 billion for its credit segment. Although the reported figures use different definitions, there is still evident institutional appetite.
Chief Financial Officer Alan Kirshenbaum stated the company had “troughed by way of inflows.” Evercore ISI noted “reasonable asset growth all things considered.” The weakest area was still private-wealth fundraising. Reuters
Blue Owl has appointed Takeo Ikemori as head of institutional capital in Japan, aligning with its focus on institutional growth. Ikemori noted that Japanese demand for private markets had increased “considerably.” Blue Owl Capital
Risks: Credit AUM declined to $158.1 billion, down from $159.2 billion in the previous period. Private-wealth fundraising dropped to $1.7 billion, compared to $4.4 billion before. Two funds maintained quarterly withdrawal caps at 5%. The expected fee increase remains contingent on deployment.
The most straightforward update this week is expected on Wednesday. Blue Owl Capital Corporation NYSE:OBDC will release its results after markets close on August 5, followed by a conference call at 10:00 EDT on August 6. Investors will be watching the numbers closely for an updated view on credit quality.
Blue Owl now faces a straightforward challenge. The firm needs real-assets fundraising to convert into fee-generating AUM more quickly than credit outflows erode its foundation. Monday’s share rise reflected optimism for improvement rather than a full recovery.