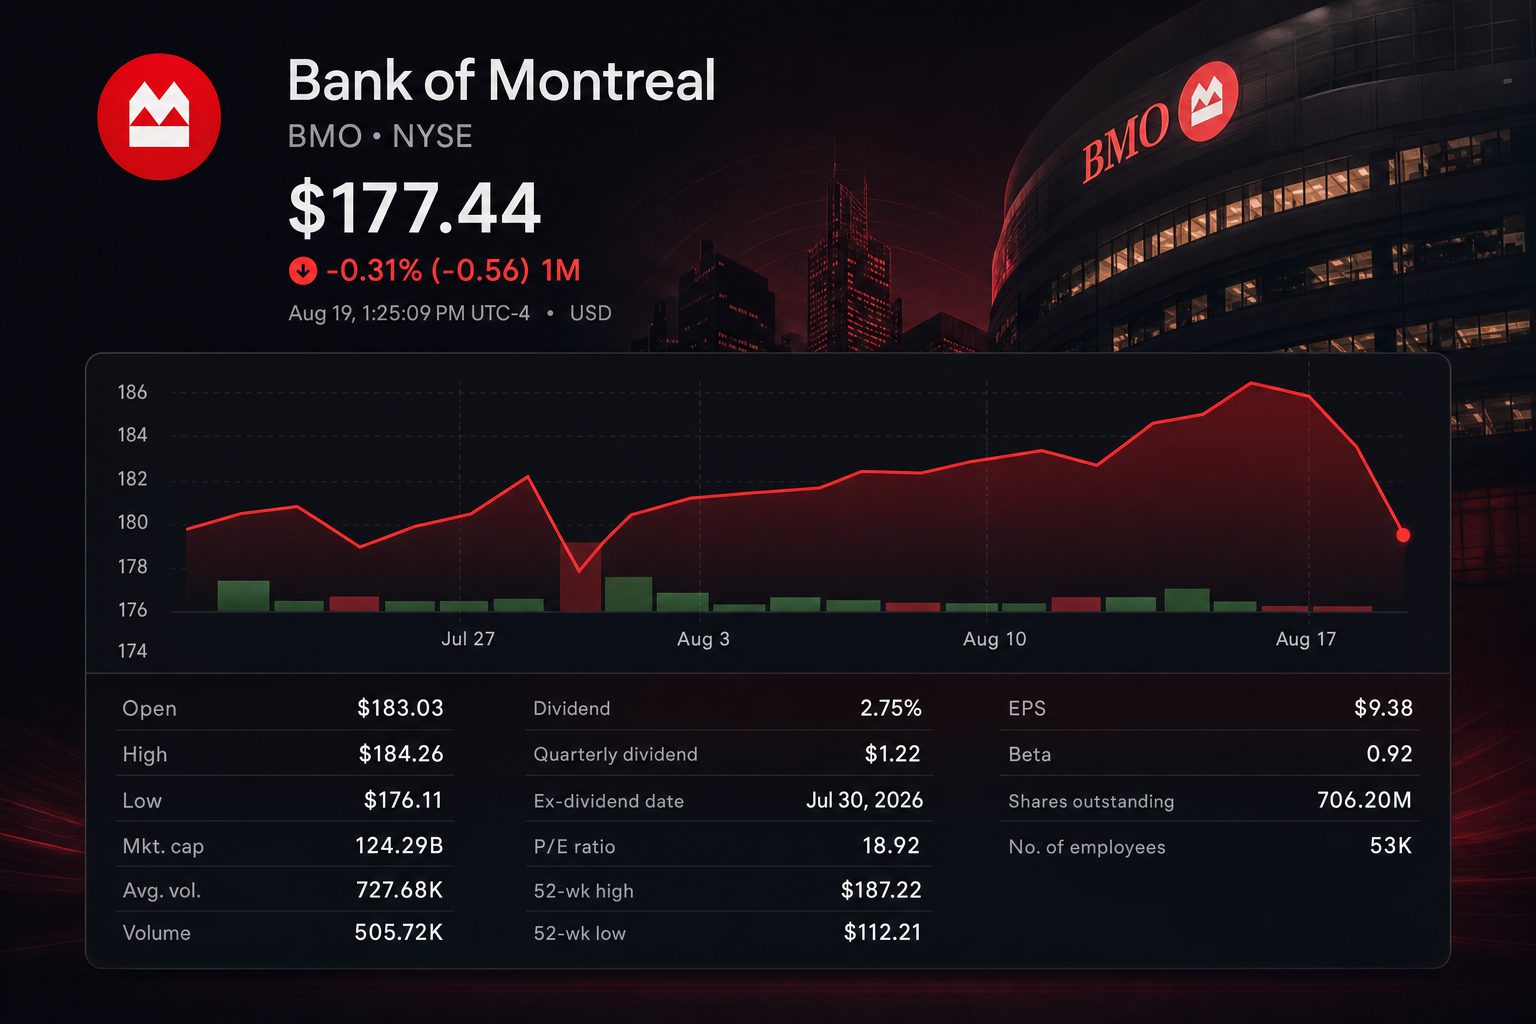
TORONTO, August 19, 2026, 13:22 EDT — Bank of Montreal TSX:BMO NYSE:BMO shares fell 3.5% to C$244.95 on Wednesday. The drop put the stock just C$1.41 below analysts’ average target, with six days left before quarterly results.
That narrow gap is the investor test. The C$246.36 average target implies only 0.6% upside from the intraday price. BMO needs more than a routine earnings beat to reopen that valuation space.
- BMO reports fiscal third-quarter results before the open on August 25.
- The consensus adjusted EPS estimate is C$3.74, up 15.8% year on year.
- Analysts’ average target sits only C$1.41 above Wednesday’s intraday price.
| Pre-earnings setup | Latest figure | Investor reading |
|---|---|---|
| TSX price | C$244.95 | Down 3.53% at 13:10:56 EDT |
| Average 12-month target | C$246.36 | 0.57% implied upside |
| Target range | C$197–C$278 | Wide outcome range |
| Q3 adjusted EPS estimate | C$3.74 | 15.8% above C$3.23 a year earlier |
| Report date | August 25 | Before market open |
The estimate is demanding but not unprecedented. BMO earned adjusted EPS of C$3.67 last quarter, 6.4% above the C$3.45 forecast. It also posted 40% annual EPS growth.
| Q2 scorecard | Q2 2026 | Year-earlier comparison |
|---|---|---|
| Adjusted net income | C$2.733 billion | Up 34% |
| Adjusted diluted EPS | C$3.67 | Up 40% |
| Provision for credit losses | C$739 million | Down from C$1.054 billion |
| Adjusted ROE | 13.5% | Up from 9.8% |
| CET1 ratio | 13.0% | Down from 13.5% |
| Quarterly dividend | C$1.71 | Up 5% |
Chief Executive Darryl White said the quarter showed “meaningful progress and momentum against these commitments.” The figures support that claim. Credit costs fell while each operating business lifted adjusted profit. BMO statement
The harder hurdle is return on equity. Adjusted ROE reached 13.5% last quarter, leaving a 150-basis-point gap to BMO’s goal of more than 15% by 2028. Investors will watch whether revenue growth closes that gap without weakening capital.
| Operating group | Q2 adjusted net income | Change year on year |
|---|---|---|
| Canadian P&C | C$887 million | +15% |
| U.S. Banking | C$847 million | +25% |
| Wealth Management | C$444 million | +39% |
| Capital Markets | C$641 million | +46% |
The earnings mix matters. Capital Markets and Wealth supplied the fastest growth last quarter. U.S. Banking still produced C$847 million despite currency pressure, making it central to the 2028 plan.
Credit quality remains the cleanest swing factor. Total provisions dropped by C$315 million last quarter. A renewed increase would absorb part of the forecast EPS growth and slow the ROE climb.
| Analyst recommendation | Count | Share of 14 analysts |
|---|---|---|
| Buy | 4 | 28.6% |
| Hold | 7 | 50.0% |
| Sell | 3 | 21.4% |
| Overall consensus | Neutral | |
The rating split shows limited conviction. Half of the analysts recommend holding the shares. Recent published targets also straddle the market price, rather than pointing in one direction.
Peers sold off too. Toronto-Dominion Bank TSX:TD fell 2.9%, Bank of Nova Scotia TSX:BNS lost 2.7%, and Canadian Imperial Bank of Commerce TSX:CM dropped 3.3% in Wednesday trading. BMO’s decline was the largest of that group.
Risks: A weaker Canadian consumer, U.S. credit losses, currency moves, or higher expenses could undercut the EPS estimate. Conversely, another sharp provision decline could push results above the current target range.
The near-term conclusion is simple. At C$244.95, BMO already trades near the average analyst target. The August 25 report must improve both earnings and the route to 15% ROE.
Related articles: NYSE:BMO

One target. Two tests.
Analyst ceiling
Only 0.57% above spot
Q3 EPS estimate
+15.8% year on year
Next catalyst
Before the market opens
Capital buffer
Down 10 bps quarter on quarter
Price versus target range
Earnings momentum
ROE route
Q2 profit engines
Analyst split
Half of the 14 analysts recommend holding.