NEW YORK, July 29, 2026, 19:01 EDT – Carvana NYSE:CVNA stock fell after the company’s latest guidance indicated profit growth would lose momentum in the latter half of the year.
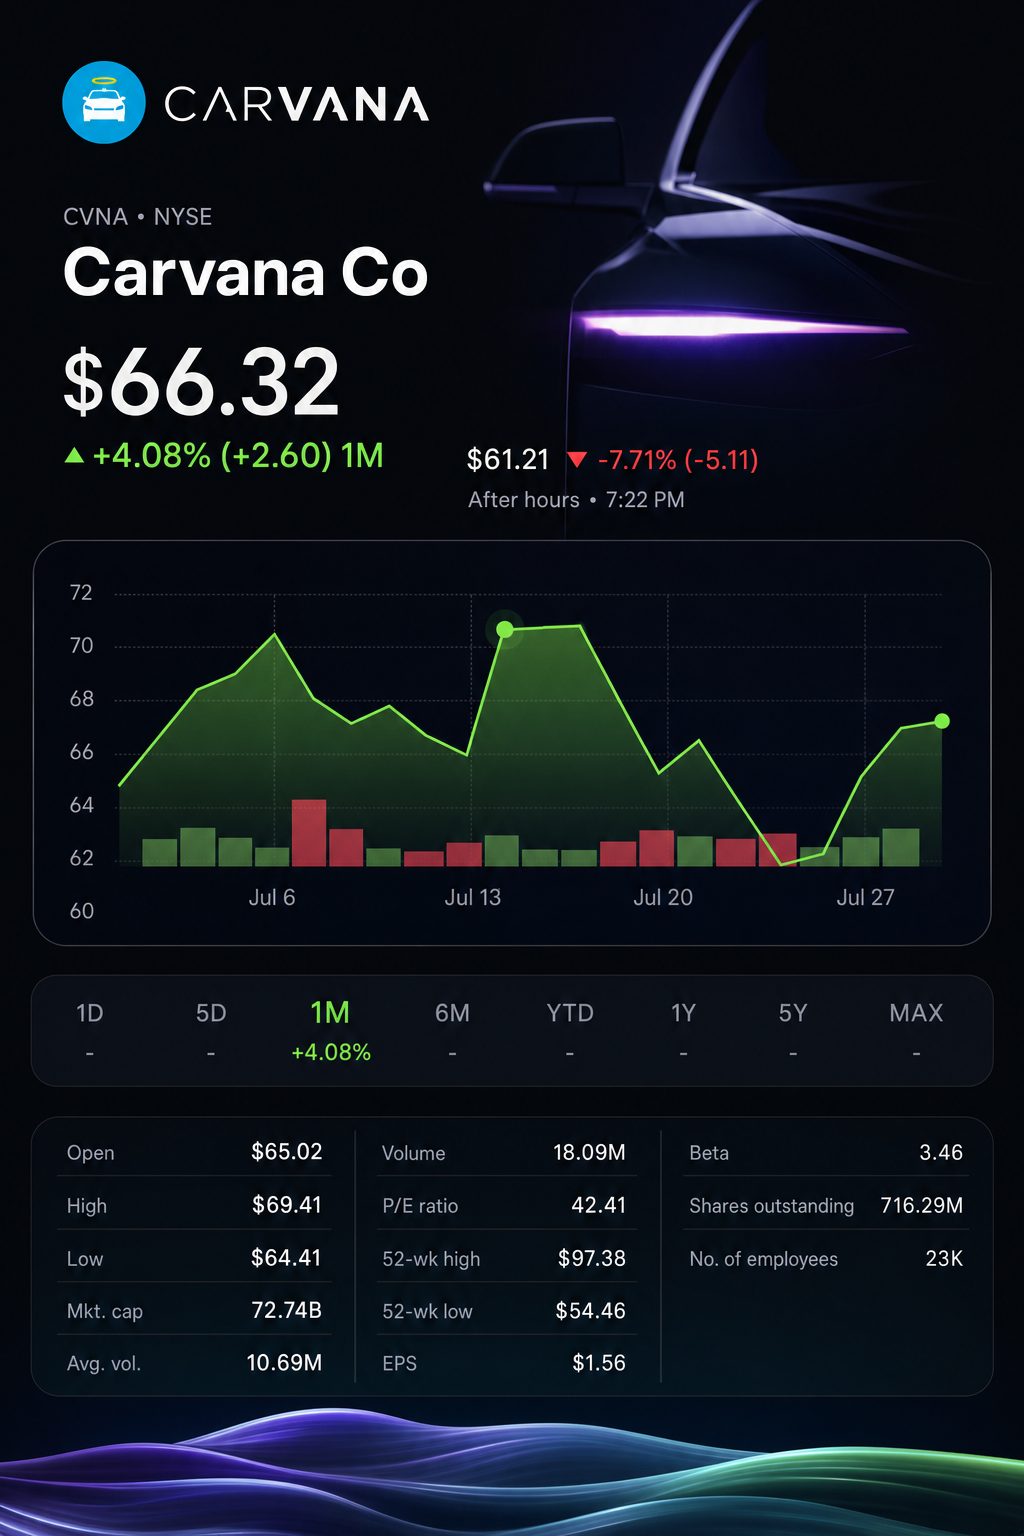
The stock dropped 8.1% to $60.95 in extended after-hours trading.
Revenue was 7.5% above consensus, though adjusted EBITDA margin decreased by two points.
The midpoint of the guidance suggests adjusted EBITDA for the second half will be 2.2% lower than in the first half.
Carvana stock declined by 8.1% in after-hours trading on Wednesday as investors concentrated on the company’s full-year outlook, which signals limited profit growth in the latter half of the year. New York trading closed earlier, but after-hours transactions were ongoing.
The adjusted EBITDA guidance midpoint is set at $2.85 billion, implying $1.409 billion for the period from July to December. This figure is 2.2% under the $1.441 billion recorded for the first half of the year. The calculation reflects an estimate rather than distinct guidance from the company.
The discrepancy stands out. Carvana projects higher retail sales in the third quarter compared to the second. However, its adjusted EBITDA margin dropped to 10.4% from 12.4%.
The quarter set a record and showed broad strength. Revenue climbed 52%, with a 38% increase in retail unit sales. Adjusted EBITDA rose at a slower pace, up 28%.
Metric
Q2 2026
Q2 2025
Change
Revenue
$7.376 billion
$4.840 billion
+52%
Retail units sold
197,325
143,280
+38%
Net income attributable to Carvana Co.
$310 million
$183 million
+69%
Diluted earnings per share
$0.42
$0.26
+62%
Adjusted EBITDA
$769 million
$601 million
+28%
Adjusted EBITDA margin
10.4%
12.4%
-2.0 points
Revenue exceeded the $6.86 billion analyst consensus by $516 million, representing a 7.5% increase. Consolidated net income totaled $513 million, with $310 million attributable to Carvana Co.
Guidance metrics now outweigh the quarter’s results in importance. Carvana did not separate its annual outlook into first and second halves. The second-half numbers below are estimated calculations.
Full-year scenario
2026 adjusted EBITDA
First-half actual
Implied second half
H2 compared to H1
Low end
$2.700 billion
$1.441 billion
$1.259 billion
-12.6%
Midpoint
$2.850 billion
$1.441 billion
$1.409 billion
-2.2%
High end
$3.000 billion
$1.441 billion
$1.559 billion
+8.2%
The midpoint continues to suggest 22.7% growth in the second half of 2025. Adjusted EBITDA rose by 32.3% in the first half. This means the projected growth rate declines by 9.6 percentage points.
Gross profit per unit (GPU) highlights some of the cautious outlook. Overall GAAP GPU dropped 5.5% to $7,014. All major non-GAAP GPU components registered decreases as well.
Metric per retail unit
Q2 2026
Q2 2025
Change
Total GPU, GAAP
$7,014
$7,426
-5.5%
Retail GPU, non-GAAP
$3,629
$3,734
-2.8%
Wholesale GPU, non-GAAP
$861
$1,019
-15.5%
Other GPU, non-GAAP
$2,635
$2,827
-6.8%
SG&A expense, GAAP
$3,568
$3,846
-7.2%
Overhead expense
$978
$1,250
-21.8%
Cost leverage helped ease that pressure. Selling, general and administrative expense per unit declined by 7.2%. Overhead was down 21.8%, while operations expense increased due to higher fuel prices.
Chief Executive Ernie Garcia stated “our model gets better as we get bigger.” The results from the quarter back up the scalability argument, but also highlight continued gross-profit pressure.
The stock approached earnings with recent momentum, climbing 10.2% in the past five sessions. Trading volume during regular hours was 67% higher than its 65-day average.
Market measure
Wednesday reading
Comparison
Regular close
$66.32
Up 0.38%
Delayed after-hours price
$60.95
Down 8.10%
Regular-session volume
18.08 million
1.67 times the average
Five-day performance
Up 10.18%
Prior to earnings impact
Year-to-date performance
Down 21.43%
As of regular close
The decline after hours wiped out much of the five-day gain, but the move did not completely undo the advance. At the close of regular trading on Wednesday, the stock was still down 21.4% for 2026.
The next comprehensive test is set for Thursday at 9:30 a.m. EDT when markets open. The U.S. jobs report for July will be released August 7 at 8:30 a.m. EDT. Trends in employment may influence demand for vehicles and impact borrower performance.
Risks persist. The outlook is based on steady conditions. Variables such as consumer demand, used-vehicle pricing, fuel expenses, tariffs, credit outcomes and reconditioning processes could push results beyond the projected range.
What caused Carvana's stock to decline following its record-setting second-quarter performance?
Carvana (CVNA) shares fell around 8.0% after hours to near $61 by 7 p.m. ET, after briefly hitting $52.40, nearly 21% below their regular session close. Public Revenue surpassed a $6.91 billion consensus by about $466 million, with consensus estimates showing minor differences among market-data sources. StockAnalysis The stock move followed guidance that was below heightened market expectations. Carvana forecast 2026 adjusted EBITDA between $2.7 billion and $3.0 billion. The Wall Street Journal After-hours pricing is subject to change until regular trading restarts.
How did Carvana perform in the second quarter of 2026?
Retail vehicle sales totaled 197,325 units, an increase of 38% from a year earlier. Revenue climbed 52% to $7.376 billion, marking a new quarterly high. Gross profit totaled $1.384 billion, and adjusted EBITDA hit $769 million. Consolidated net income reported at $513 million reflected a 7.0% margin. Carvana Investors Of that amount, $310 million was reported for Carvana’s Class A stockholders, while noncontrolling interests represented $203 million. Diluted earnings per split-adjusted Class A share were $0.42.
Are margins rising at the same pace as sales volume?
No, not in this quarter. Adjusted EBITDA margin dropped to 10.4%, compared with 12.4% a year ago. Total GAAP gross profit per retail unit declined by $412 to $7,014. Retail gross profit per unit eased 2.4%, while wholesale fell 13.0%. Carvana Investors But GAAP SG&A per unit was $278 lower at $3,568. Despite weaker unit economics, increased scale boosted adjusted EBITDA dollars by 28%.
How does Carvana’s 2026 outlook reflect on performance expectations for the second half?
Carvana forecasts third-quarter retail units will exceed 197,325. The company projects full-year adjusted EBITDA in the range of $2.7 billion to $3.0 billion. Carvana Investors In the first half, Carvana generated $1.441 billion, leaving an estimated $1.259 billion to $1.559 billion needed in the second half to reach guidance. Based on the midpoint, adjusted EBITDA for each remaining quarter averages roughly $705 million. Carvana Investors That figure is below the $769 million reported in Q2, even as Carvana anticipates higher Q3 unit volumes. The company did not include a GAAP reconciliation with the forecast, citing that several future adjustments cannot yet be estimated.
Does Carvana now have a sufficiently robust balance sheet?
Liquidity has seen gains, though leverage remains significant for holders of common stock. Cash at the end of June totaled $2.630 billion, set against $5.1 billion in principal debt. That results in an estimated funded net debt of roughly $2.47 billion. Stock Titan Committed liquidity resources reached $4.669 billion by the quarter’s close. The overall $7.024 billion figure includes possible further borrowing. Stock Titan Operating cash flow for the first half reached $345 million, even with $833 million used for inventory. Stock Titan The company’s management expects current resources to fund at least twelve months of operation.
Is CVNA trading at a bargain around the most recent after-hours price?
Not solely based on current guidance. Carvana’s as-converted economic share count is about 1.10 billion. At a price of $61 per share, the implied equity value stands near $67 billion. Stock Titan Including estimated net debt, total enterprise value comes to about $69.5 billion. The ratio to the $2.85 billion adjusted EBITDA midpoint is roughly 24 times. Stock Titan This calculation presumes that both debt levels and share count are largely unchanged. Adjusted EBITDA, which does not account for some GAAP expenses, makes straight comparisons less precise.
What is a realistic 12-month price target for CVNA?
The most recent consensus target stands at $89.83, spanning a $67-to-$120 range. Most analyst targets referenced were set ahead of the Q2 release and subsequent after-hours drop. StockAnalysis On the bearish side, a target between $50 and $60 per share assumes guidance comes in weak and per-unit profitability continues to deteriorate. Carvana Investors The base scenario ranges from $70 to $90 with margins close to 10%. The bullish scenario targets $95 to $120, contingent on stronger-than-expected adjusted EBITDA growth. These represent possibilities, not assurances.
How does Carvana's performance compare to the S&P 500?
Carvana was added to the S&P 500 on December 22, 2025. S&P Global CVNA shares had declined by about 20% to 21% for the year ahead of the announcement. TradingView The S&P 500 had gained 6.9% through Wednesday’s market close. AP News That marks an underperformance of roughly 27 percentage points. Should the after-hours slide persist, the disparity would increase. These figures use May’s five-for-one stock split basis. Reuters Entry to the index drives passive flows but does not guarantee valuation stability.
How achievable is Carvana’s growth goal for 2030 to 2035?
The calculations are tough but achievable. Q2’s annualized retail sales rate reached about 789,000 vehicles. Hitting three million units would require nearly 3.8 times that level. Depending on the timetable, annual unit expansion must be in the range of around 16% to 40%. Carvana Investors The 10.4% adjusted EBITDA margin in Q2 remains 3.1 percentage points shy of the target. Carvana Investors Carvana says its built capacity is about 1.5 million units, plus real estate for up to three million. Carvana Investors Key issues remain execution, financing availability, and unit economics.
Leokadia Głogulska is a financial and technology journalist at TS2.tech. Her coverage ranges from stocks and artificial intelligence to space technology and developments across global markets. She graduated from Wrocław University of Economics and Business and worked in financial analysis before becoming a business journalist.
Surprising starts and permits data can impact homebuilders, mortgage-sensitive stocks, Treasury yields, and the dollar if results deviate significantly from consensus estimates.
#02
Home Depot Q2
The results and outlook provide key insights into housing turnover, renovation demand, professional customer activity, and U.S. discretionary spending.
#03
09:15 ET industrial production
A robust or disappointing factory or utilities report can shift expectations for economic growth, cyclical stocks, bond yields, and the Federal Reserve’s policy direction.