Share price
$112.85
+4.85% today
Prior close: $107.63
SUGAR LAND, Texas, August 25, 2026, 11:06 EDT — Applied Optoelectronics stock rose 5% following the announcement of a third at-the-market equity program that aims to raise up to $600 million.
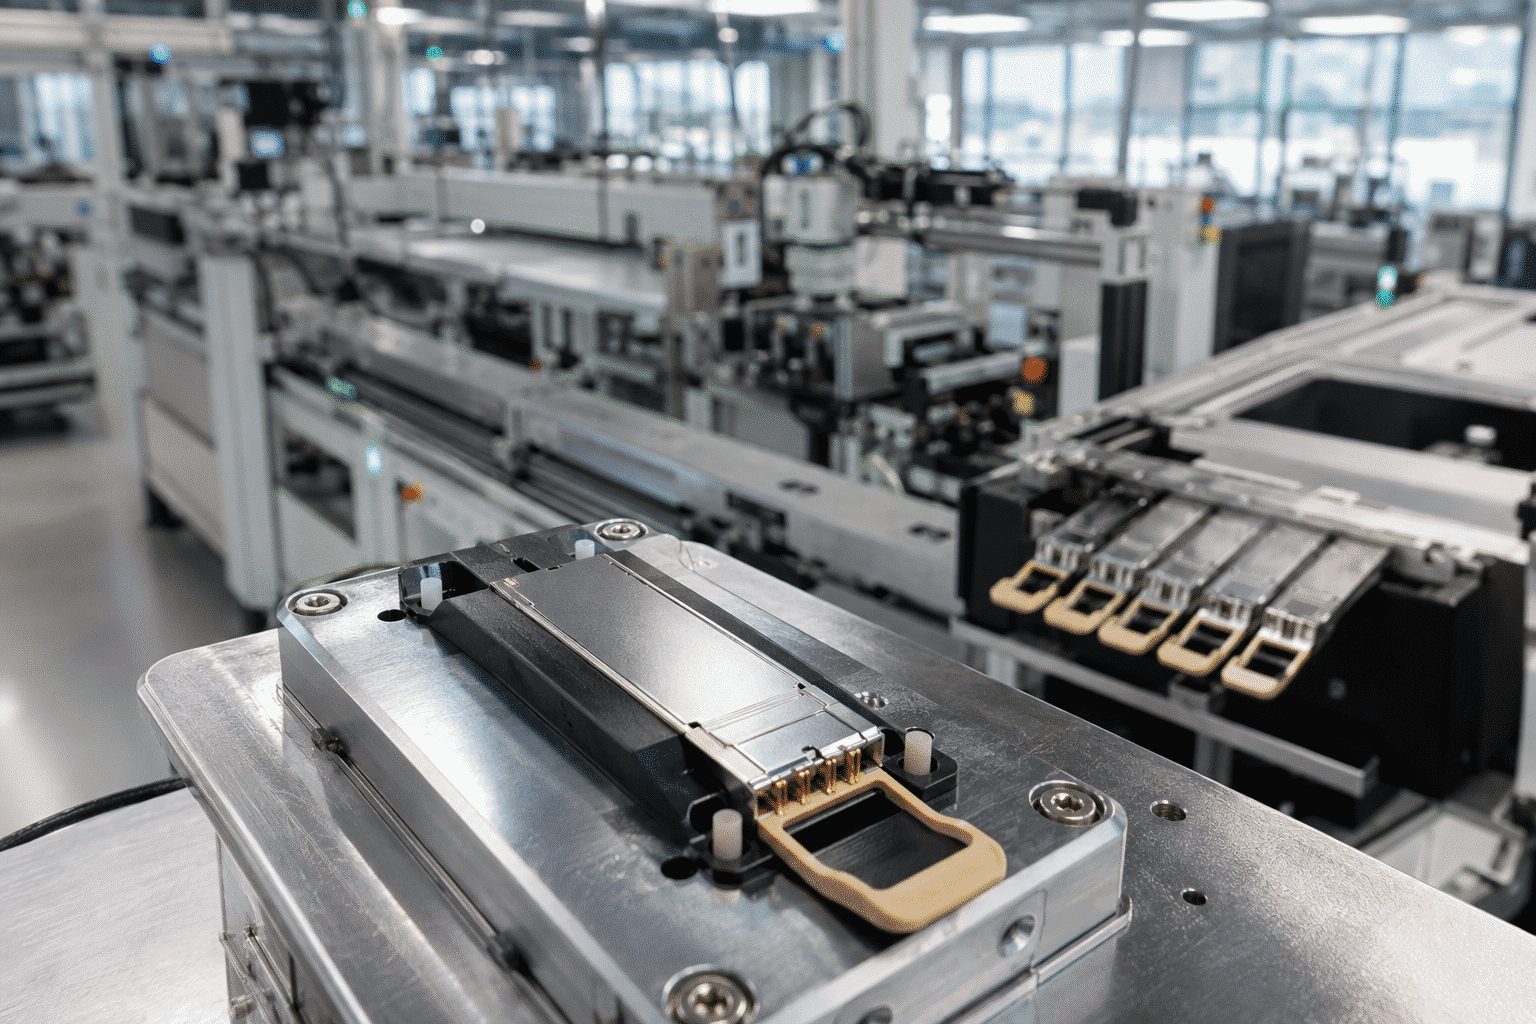
Factory expansion is being financed with a third large ATM program.
*Illustrative full $600M sale at $112.85. The company controls timing and amount; actual issuance can differ.
| Program | Authorized | Shares sold through June | Net proceeds |
|---|---|---|---|
| First | $500M | 4.83M | $490.0M |
| Second | $600M | 2.95M | $538.8M |
| August | $600M | Not disclosed | Not disclosed |
| Total | $1.70B | 7.78M+ | $1.03B+ |
Six months ended June 30, 2026. *Cash, cash equivalents and restricted cash.
| Metric | Q2 2026 | Q2 2025 | Change |
|---|---|---|---|
| Revenue | $191.9M | $103.0M | +86.4% |
| Gross profit | $53.2M | $31.2M | +70.7% |
| GAAP gross margin | 27.7% | 30.3% | −2.6 pts |
| GAAP net loss | −$22.8M | −$9.1M | Loss widened |
| Non-GAAP EPS | $0.06 | −$0.16 | Turned positive |
| Guidance | Low | High | Sequential read |
|---|---|---|---|
| Revenue | $255M | $290M | +33% to +51% |
| Non-GAAP gross margin | 29.0% | 30.5% | Above Q2 GAAP margin |
| Non-GAAP net income | $10.1M | $24.0M | Profit ramp |
| Non-GAAP EPS | $0.11 | $0.26 | 92.8M assumed shares |
| Analyst | Firm | Rating | Target | Target vs $112.85 |
|---|---|---|---|---|
| Michael Genovese | Rosenblatt | Buy | $220 | +94.9% |
| Ryan Koontz | Needham | Buy | $190 | +68.4% |
| Simon Leopold | Raymond James | Buy | $178 | +57.7% |
| Tim Savageaux | Northland | Hold | $120 | +6.3% |
| Dave Kang | B. Riley | Hold | $109 | −3.4% |
Six-analyst consensus: Buy. Average target: $163.40, or 44.8% above the 11:06 EDT quote.
ATM sale pace800G output1.6T rampGross marginCustomer concentration
Added capacity converts strong demand into revenue faster than share issuance expands the base.
Ramp costs, deployment delays or lower selling prices weaken returns on newly raised capital.
NASDAQ: AAOI · Company dashboard
Market snapshot: August 24, 2026, 18:44 EDT. Regular-session prices are official 16:00 EDT closes; after-hours figures are separately labelled. Fundamentals use the latest reported quarter or trailing period.
Cash close
$107.63
Aug. 24, 16:00 EDT
Daily move
−13.77%
−$17.19 per share
After hours
$108.18
+0.51%, 18:44 EDT
Volume
14.99M
Aug. 24 cash session
Market cap
$9.14B
At Aug. 24 close
Forward P/E
46.8×
S&P Global snapshot
Regular-session closes, August 17–24, 2026. The final gap followed the August 21 ATM filing.
| Revenue, Q2 2026 | $191.9M | +86% YoY |
| GAAP net income, Q2 | −$22.8M | Loss |
| Adjusted net income, Q2 | $5.5M | Positive |
| Cash + restricted cash, Jun. 30 | $508.8M | Reported |
| Revenue, trailing 12 months | $596.0M | Aug. 24 snapshot |
| Net income, trailing 12 months | −$57.0M | Loss |
Company Q3 guidance was issued August 6, 2026. Full-year revenue and free-cash-flow estimates were last updated August 19, 2026.
| Company | Close | Day | Forward P/E | Market cap |
|---|---|---|---|---|
| AAOI | $107.63 | −13.77% | 46.8× | $9.14B |
| LITE | $830.17 | −4.22% | 38.4× | $74.47B |
| COHR | $275.49 | −4.85% | 29.3× | $53.95B |
| GLW | $145.55 | −2.86% | 40.5× | $125.38B |
AAOI underperformed the three-peer average decline of 3.98% by 9.79 percentage points.
| Firm | View | Target |
|---|---|---|
| Rosenblatt | Buy | $220 |
| Needham | Buy | $190 |
| Raymond James | Outperform | $178 |
| Northland | Market Perform | $120 |
| B. Riley | Neutral | $109 |
Six-analyst consensus: Buy. Average target: $163.40, or 51.8% above the August 24 close. The listed calls date from August 7–19.
| Shares outstanding | 84.91M |
| $600M / $109.68 | 5.47M shares |
| Potential count increase | 6.4% |
| ATM / Friday market cap | 5.7% |
| Value loss / ATM size | 2.14× |
| Metric | Result |
|---|---|
| Revenue | $191.9M · +86% |
| Data-center sales | $107.7M · +140% |
| GAAP margin | 27.7% · -2.6 pts |
| GAAP net loss | $22.8M |
| Stock | Move |
|---|---|
| AAOI | -12.13% |
| COHR | -4.39% |
| LITE | -4.47% |
| Call | Target |
|---|---|
| Rosenblatt · Buy | $220 |
| Needham · Buy | $190 |
| Raymond James · Buy | $178 |
| Northland · Hold | $120 |
| B. Riley · Hold | $109 |
| Reference | Amount | ATM multiple |
|---|---|---|
| Cash + restricted cash | $508.8M | 1.18× |
| Q3 revenue midpoint | $272.5M | 2.20× |
| H1 capex | $335.1M | 1.79× |
| H1 investing cash use | $633.7M | 0.95× |
| Q2 actual | $191.9M |
| Q3 low | $255.0M |
| Q3 midpoint | $272.5M |
| Q3 high | $290.0M |
| Sale price | New shares | Dilution |
|---|---|---|
| $129.10 | 4.65M | 5.47% |
| $124.82 | 4.81M | 5.66% |
| $112.56 | 5.33M | 6.28% |
| Low target | $109 |
| Average | $163.40 |
| Median | $178 |
| High | $220 |
NASDAQ: AAOI · Investor snapshot
Applied Optoelectronics, Inc. · U.S. market closed Friday, August 21, 2026
-3.32% Friday
Closed August 21 at 4:00 p.m. EDT.
-9.83% vs. close
Nasdaq last sale at 6:25 p.m. EDT. Extended-hours prices can be thin.
Raymond James and Needham may sell shares over time. AOI is not required to use it.
2% sales commissionAt Friday's close, equal to 5.7% of the 84.91 million shares outstanding on August 20.
The balance sheet is liquid, but capacity expansion consumes cash quickly. The new authorization is 1.18× June cash plus restricted cash.
Midpoint implies 42.0% sequential growth. Management says demand may exceed capacity through mid-2027.
Consensus: Buy from six analysts. Three were Holds. Targets were last updated before the ATM filing.
The SEC illustration is mechanical, not a forecast. Actual prices and issued shares will vary.
Equity funds the 800G and 1.6T ramp. Q3 revenue reaches or exceeds the $272.5 million midpoint.
AOI sells gradually. Investors weigh added capacity against a persistent supply overhang.
Weak pricing forces more shares into the market while production delays or customer timing slow the ramp.
Sources: August 21 Form 8-K, prospectus supplement, Q2 Form 10-Q, company Q2 release, S&P Global analyst data via StockAnalysis, and Nasdaq market data. Calculations use displayed figures and may differ due to rounding.