

SYDNEY, August 23, 2026, 10:00 AEST — Shares of Commonwealth Bank of Australia (CBA) were down 5.5% for the week, with nearly a third of the drop linked to the impact of its dividend payout.
- CBA declined by 5.5% last week to A$157.99, with A$2.70 attributed to an ex-dividend adjustment.
- The preliminary estimate for the dividend-adjusted weekly return was around -3.9%.
- Every one of the 14 analysts monitored holds a bearish outlook; their target suggests a 20.75% potential decrease.
- Mortgage applications declined by 15%, even as the company reported a record cash profit for FY2026.
Commonwealth Bank of Australia ASX:CBA fell 5.5% last week, but the main decline does not fully reflect the financial impact. The stock’s A$2.70 final dividend began trading ex-dividend on Wednesday, accounting for around 29% of the A$9.18 decrease since the previous Friday.
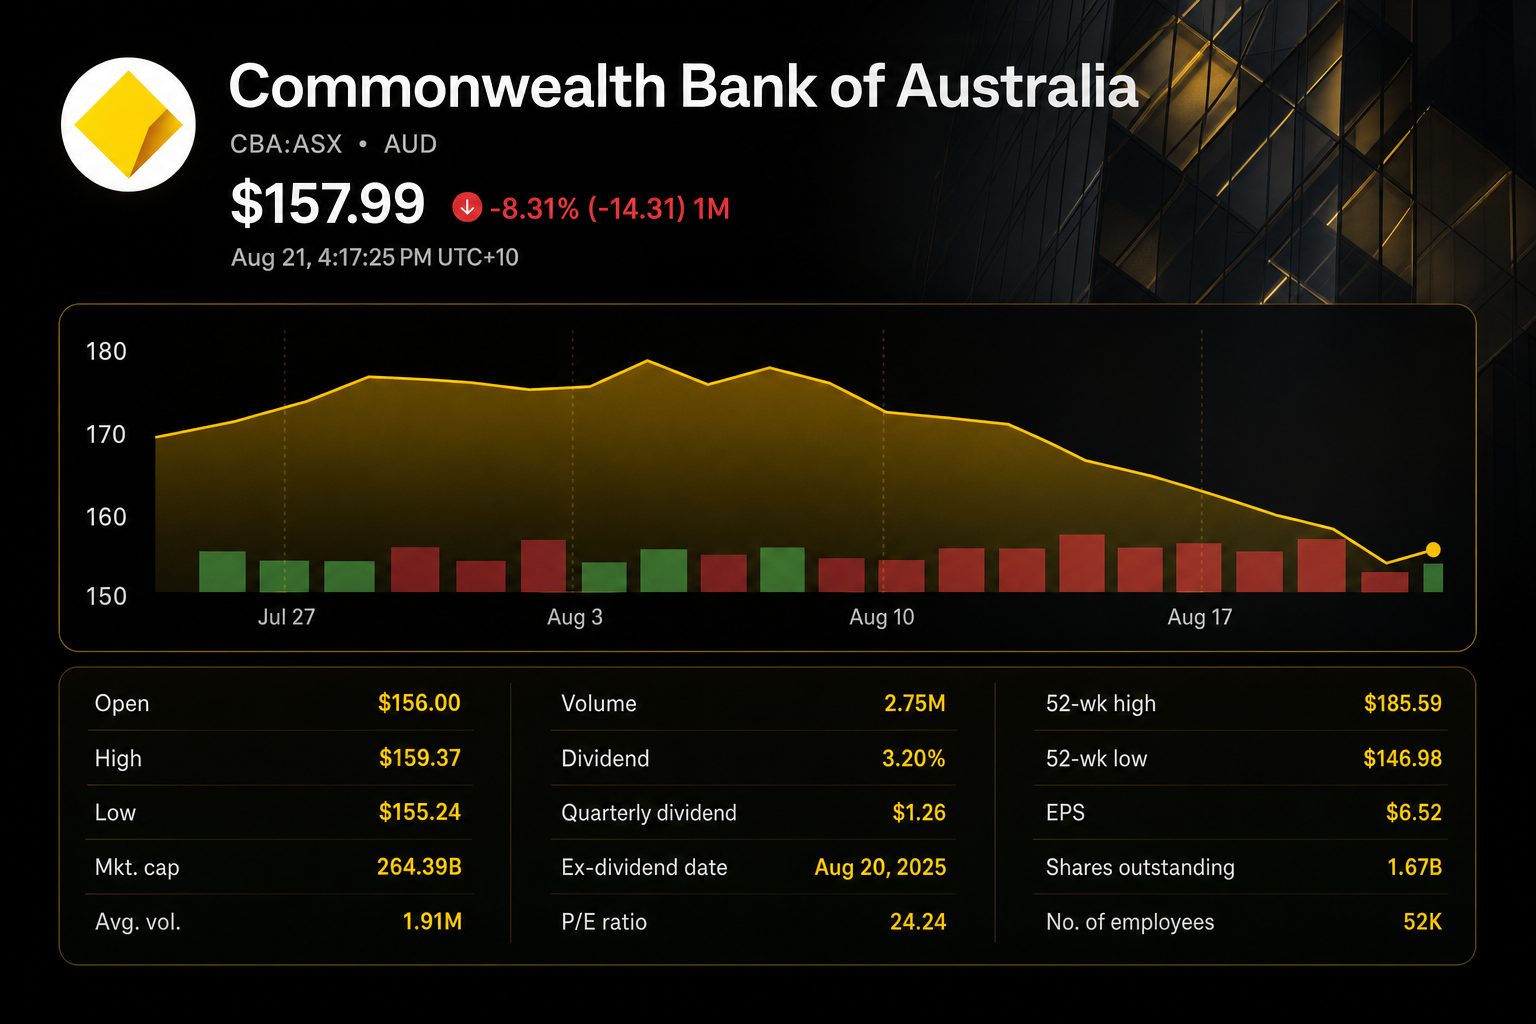
Shares ended Friday at A$157.99, rising 0.99% on the day. When factoring in the dividend, the early estimate for weekly total return stood at roughly -3.9%. This detail is significant for those assessing if the decline has run its course.
The adjusted drop was significant. CBA’s premium valuation collided with a softer mortgage outlook, increased credit costs and a unanimously bearish analyst consensus. This led to a clear de-rating below the level of dividend mechanics.
| Session | Close (A$) | Daily move | Context |
|---|---|---|---|
| Aug. 14 | 167.17 | -1.08% | Selling continues after results |
| Aug. 17 | 165.00 | -1.30% | Mortgage-related worries linger |
| Aug. 18 | 162.63 | -1.44% | Last day trading with dividend rights |
| Aug. 19 | 160.71 | Ex-dividend | A$2.70 per share entitlement detaches |
| Aug. 20 | 156.44 | -2.66% | Selling pressure extends |
| Aug. 21 | 157.99 | +0.99% | Shares recover on Friday |
The calculation distinguishes between two impacts. The overall drop in market value was approximately A$15.3 billion, using Friday’s closing prices and market capitalisation. CBA’s final dividend amounts to A$4.52 billion. This results in an estimated A$10.8 billion in initial value lost, excluding the effect of the dividend payout.
| Weekly bridge | Per share | Estimated equity value |
|---|---|---|
| Total decrease in price | A$9.18 | About A$15.3bn |
| Final dividend removed | A$2.70 | A$4.52bn |
| Net remaining decrease | A$6.48 | About A$10.8bn |
| Dividend-adjusted performance | -3.9% | Initial estimate |
CBA posted its highest-ever result for FY2026. Cash net profit climbed 7.1% to A$10.98 billion, with operating income up 6.2% to A$30.22 billion. The bank declared a full-year dividend of A$5.05 per share.
| FY2026 measure | Result | Year-on-year |
|---|---|---|
| Cash net profit | A$10.98bn | up 7.1% |
| Operating income | A$30.22bn | rose 6.2% |
| Net interest margin | 2.05% | down 3 bps |
| Operating expenses | — | increased 5.6% |
| Loan impairment expense | A$788m | climbed 8.5% |
| CET1 capital ratio | 12.0% | fell 30 bps |
CBA maintained its strong franchise, recording growth in retail and business lending and deposits that matched or exceeded the market. Chief Executive Matt Comyn stated the bank achieved this “without sacrificing margin.” Commonwealth Bank
However, indicators of growth have softened. Applications for home loans declined 15% following the May budget and registered a 17% decrease compared to a year earlier. Investor applications fell by 28%. Despite this, the bank’s mortgage portfolio, valued at A$680 billion, expanded by approximately A$46 billion over FY2026.
| Credit signal | Latest reading | Investor meaning |
|---|---|---|
| Home-loan applications | -15% since May | Pipeline of new volume slows |
| Investor applications | -28% | Demand pressured by tax changes |
| Mortgage 90+ day arrears | 0.73% | Remain at just manageable levels |
| Loan impairment expense | +8.5% | Credit costs are rising |
| Customers ahead on repayments | 85% | Borrowers largely retain buffer |
The bank continues to invest during the slowdown. Technology and artificial intelligence spending for FY2027 is set at approximately A$2.4 billion. In FY2026, AI produced around A$200 million in gross benefits, and management projects this will rise to over A$400 million in the next year.
The return profile contributes to the market’s continued willingness to pay a premium. CBA is currently valued at 24.3 times trailing earnings. National Australia Bank Limited ASX:NAB trades at 19.9 times, ANZ Group Holdings Limited ASX:ANZ at 19.0 times, and Westpac Banking Corporation ASX:WBC at 16.7 times.
| Bank | Friday closing | Trailing P/E | Dividend payout | Analyst view |
|---|---|---|---|---|
| CBA | A$157.99 | 24.34 | 3.13% | Strong Sell |
| NAB | A$38.17 | 19.88 | 4.45% | Neutral |
| ANZ | A$37.13 | 18.97 | 4.47% | Neutral |
| Westpac | A$33.83 | 16.67 | 4.55% | Sell |
Analysts continue to show caution. The consensus target stands at A$125.21, marking a 20.75% drop from Friday’s closing price. The highest target, at A$144.99, still suggests a fall. Jefferies, Ord Minnett, and Morgan Stanley maintained their Sell ratings following the results.
| Recommendation | Analysts | Share |
|---|---|---|
| Strong Buy | 0 | 0% |
| Buy | 0 | 0% |
| Hold | 0 | 0% |
| Sell | 3 | 21% |
| Strong Sell | 11 | 79% |
| Average target | A$125.21 | 20.75% under closing price |
Monday marks a new operational milestone. CBA’s unified economic-crime framework comes into force on August 24. July figures indicated spending climbed by 0.6%, maintaining the risk the Reserve Bank could lift rates again if demand remains robust.
| Next checkpoint | Date | Why it matters |
|---|---|---|
| ASX reopens | Aug. 24, about 10:00 AEST | Assesses if Friday’s gains hold |
| Economic-crime model starts | Aug. 24 | Key step for fraud prevention and enforcement |
| A$156.44 | Technical level | Closed Thursday, suggests immediate support |
| A$162.63 | Technical level | Most recent cum-dividend closing mark |
| Final dividend payment | Sept. 29 | Fully franked A$2.70 payout |
| Annual meeting | Oct. 14 | Focus on company strategy and capital allocation |
Risks: Mortgage demand could decline further due to ongoing tax changes and elevated rates. Credit losses might increase, with the current valuation remaining above all analyst targets tracked. A cooler economy would also challenge business lending and the dividend premium.
The dividend accounts for some of last week’s decline, but not entirely. The key issue on Monday is whether CBA can hold A$156 as investors reconsider the valuation of franchise quality amid decelerating growth.
Related articles: ASX:CBA






![Asia Stock Market Today 23/08/2026 [UPDATE: 08:08 SGT] [Yield Shock Splits Asia: Weekly Recap and Week Ahead]](https://ts2.tech/wp-content/uploads/2026/08/Asia-market-dashboard-2026-08-23-0808-480x384.jpg "Asia Stock Market Today 23/08/2026 [UPDATE: 08:08 SGT] [Yield Shock Splits Asia: Weekly Recap and Week Ahead]")