

SYDNEY, August 22, 2026, 11:15 AEST
- Commonwealth Bank finished Friday at A$157.99, marking a 5.5% decline since August 14.
- The A$2.70 ex-dividend adjustment accounts for 29% of the total weekly price decline.
- The average analyst target of A$125.21 is 20.8% lower than the closing price on Friday.
Commonwealth Bank of Australia (ASX:CBA) shed approximately A$15.3 billion in market capitalization last week, despite a 1.0% recovery on Friday. Shares finished at A$157.99 on August 21, falling from A$167.17 the previous week. Australian markets are shut over the weekend.
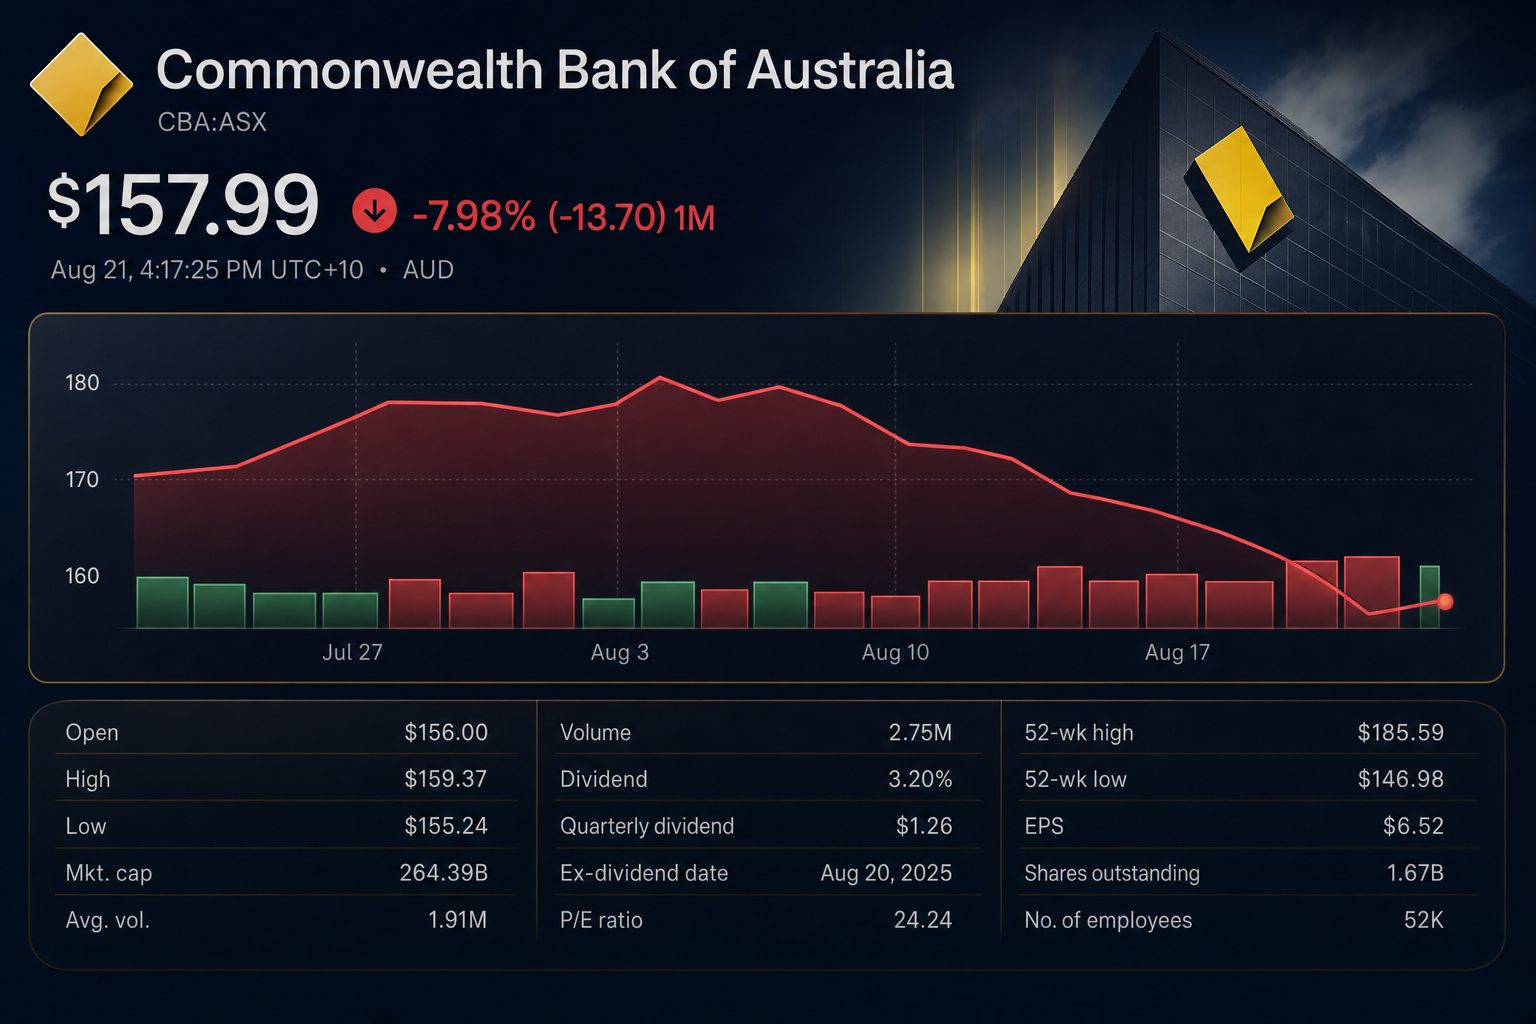
The apparent drop gives an exaggerated view of the actual economic loss, as CBA traded ex-dividend on Wednesday. Factoring the A$2.70 final dividend into Friday’s closing price, the dividend-adjusted weekly return comes to around negative 3.9%. Despite this adjustment, CBA remains under pressure following a record profit.
| Weekly price bridge | Per share | Investor reading |
|---|---|---|
| August 14 close | A$167.17 | Initial value |
| August 21 close | A$157.99 | Absolute difference: -5.5% |
| Final dividend | A$2.70 | Went ex-dividend August 19 |
| Dividend-adjusted value | A$160.69 | Change with adjustment: -3.9% |
The difference is significant. With 1.67 billion shares in circulation, the drop in price wiped out approximately A$15.3 billion. Factoring in the dividend, the real economic hit was around A$10.8 billion. The payout accounts for 29% of the A$9.18 decline per share.
Commonwealth Bank of Australia (CBA) posted a cash net profit after tax of A$10.98 billion for fiscal 2026, representing a 7.1% increase. Statutory profit recorded was A$10.91 billion. The full-year dividend climbed to A$5.05, and cash return on equity rose to 14.0%.
| FY26 measure | FY26 | FY25 | Change |
|---|---|---|---|
| Cash NPAT | A$10.982bn | A$10.252bn | +7.1% |
| Operating income | A$30.224bn | A$28.465bn | +6.2% |
| Net interest margin | 2.05% | 2.08% | -3 bps |
| Cash ROE | 14.0% | 13.5% | +50 bps |
| Dividend per share | A$5.05 | A$4.85 | +4.1% |
| CET1 capital ratio | 12.0% | 12.3% | -30 bps |
CEO Matt Comyn stated that CBA expanded in all key lending and deposit segments at or above the overall market rate. “We did that without sacrificing margin,” he said. Despite this, the reported margin still fell by three basis points due to funding and lending competition. CBA interview
Mortgage demand faces a tougher challenge. Home-loan applications decreased by 15% following the property-tax adjustments in May. Investor applications declined 28%. With CBA accounting for roughly a quarter of Australia’s A$2.4 trillion mortgage market, a slowdown in new applications could dampen balance-sheet growth, even if current borrowers stay stable.
Valuation offers a second red flag. CBA ended Friday near 23.6 times projected fiscal 2027 earnings. Analysts are forecasting just 2.0% EPS growth over the next year. The consensus target of A$125.21 suggests shares could fall by 20.8%.
| Analyst | Firm | Recommendation | Target | Date |
|---|---|---|---|---|
| Andrew Lyons | Jefferies | Sell | A$144.99 | Aug. 13 |
| Not disclosed | Ord Minnett | Sell | A$120.00 | Aug. 13 |
| Richard Wiles | Morgan Stanley | Sell | A$124.00 | Aug. 13 |
| Matthew Wilson | Jarden | Sell | A$90.00 | Aug. 12 |
| John Storey | UBS | Sell | A$135.00 | Aug. 12 |
| 14-analyst consensus | S&P Global poll | Strong Sell | A$125.21 | Aug. 13 update |
The top price target, A$144.99, remains 8.2% under Friday’s closing price. Each of the 14 analysts in the coverage group maintains a Sell or Strong Sell rating. Such a difference is rare for a bank generating profits, but it highlights the premium attributed by investors to CBA’s deposit franchise and 14% return on equity.
| Valuation check | Value | Versus Friday close |
|---|---|---|
| Friday close | A$157.99 | Reference |
| Consensus target | A$125.21 | -20.8% |
| Highest target | A$144.99 | -8.2% |
| Lowest target | A$90.00 | -43.0% |
| FY27 EPS forecast | A$6.69 | Forecast up 2.0% |
| Forward P/E | 23.6× | Still at a premium |
Risks: The lower valuation outlook may fade if deposit growth, margins, or mortgage application volumes improve more quickly than anticipated. The negative scenario remains evident: a further drop in housing credit demand, increased impairments, or fresh margin pressure would challenge the justification for the existing earnings multiple.
The coming week opens on Monday, August 24. That same day, CBA’s updated economic-crime operating model is launched, integrating teams for fraud, scams, and financial crime. Investors are set to monitor if Friday’s recovery persists following the dividend change, and whether results from the banking sector confirm the decline in mortgage demand.
Related articles: ASX:CBA