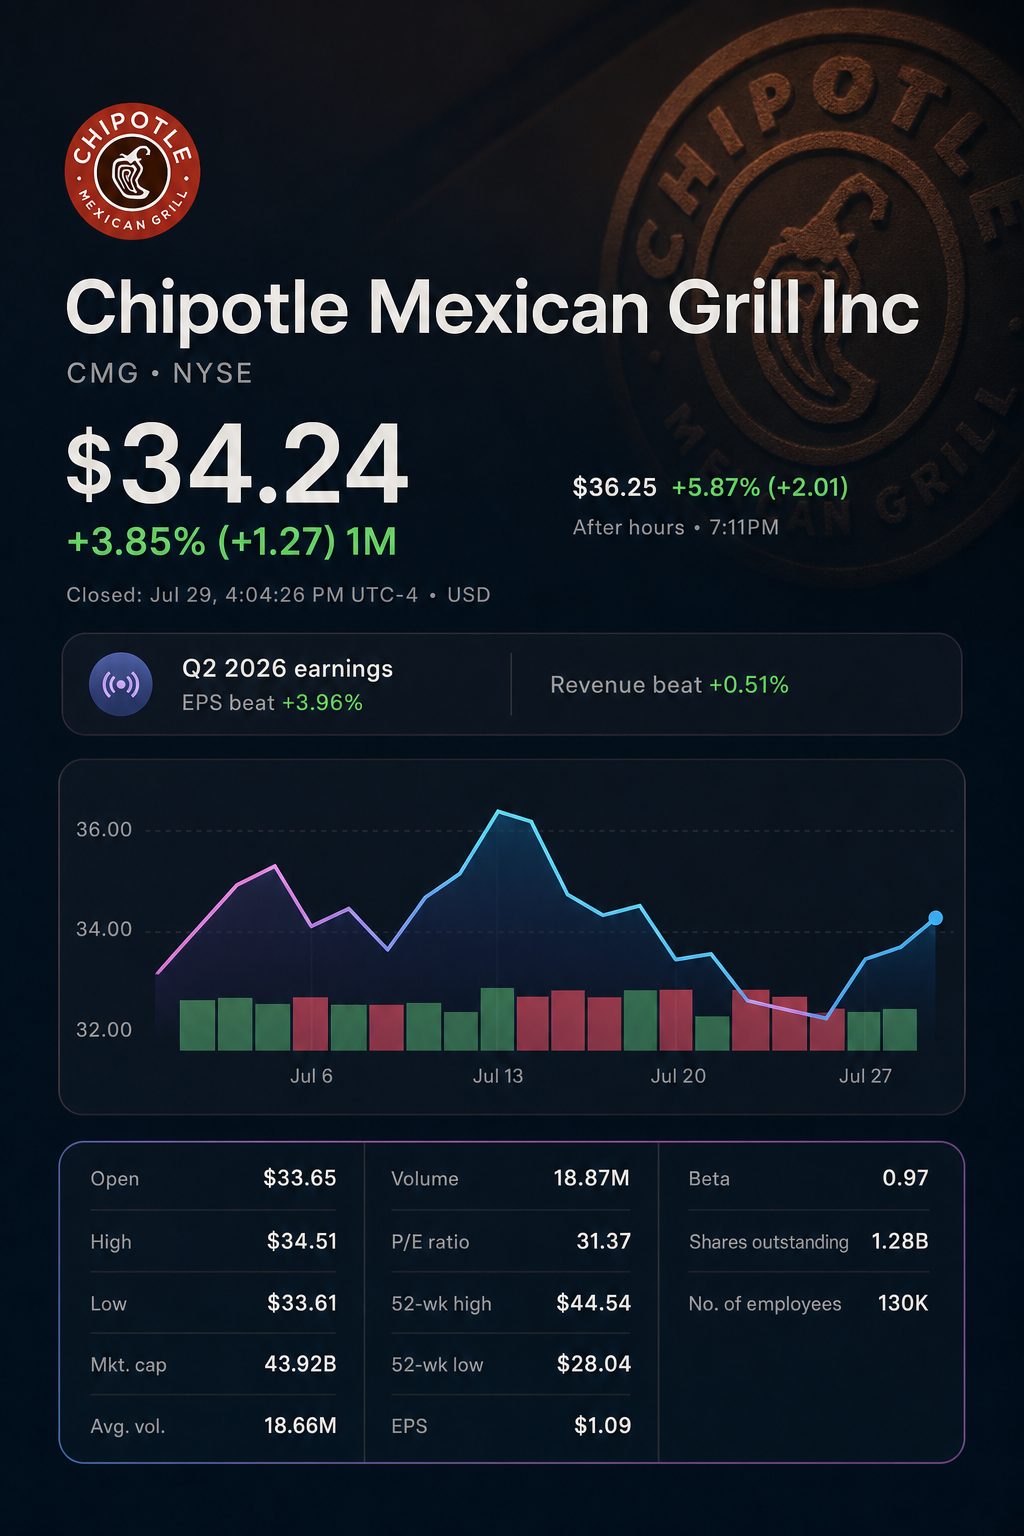
Chipotle shares climbed 5.9% in after-hours trading as the company increased its 2026 sales forecast.
Comparable sales rose by 2.2%, surpassing the 1.32% estimate from LSEG.
Adjusted net income declined by 7%. Earnings per share remained at a rounded $0.33, supported by a reduced share count.
Shares of Chipotle Mexican Grill NYSE:CMG climbed 5.9% in after-hours trading on Wednesday. The restaurant reported quarterly sales that surpassed expectations, and it raised its full-year guidance. The regular session had ended before the update.
Profit quality declined. Adjusted net income dropped 7% to $418.9 million. Diluted shares decreased 5.3%, mitigating some of the effect on earnings per share.
Q2 metric
Actual
Pre-release consensus
Year ago
Revenue
$3.349 billion
$3.33 billion
$3.063 billion
Adjusted EPS
$0.33
$0.32
$0.33
Comparable sales
2.2%
1.32%
-4.0%
Company results; LSEG and WSJ projections prior to release.
The largest outperformance was in comparable sales. Revenue surpassed expectations by about 0.6%. Adjusted EPS was one cent above consensus.
Morningstar analyst Ari Felhandler said, “Positive traffic and average check growth reflect a healthy print.” Consumers are still making selective choices. Reuters
Operating measure
Q2 2025
Q1 2026
Q2 2026
Comparable sales
-4.0%
0.5%
2.2%
Transactions
—
0.6%
1.0%
Average check
—
-0.1%
1.2%
Digital sales mix
35.5%
38.6%
38.3%
Company-owned restaurants
3,839
4,090
4,186
Chipotle reports quarterly results.
Most of the headline growth continued to come from new restaurant openings. The number of stores grew by 9.0% compared to a year ago. Revenue was up 9.3%.
Chipotle launched 100 new company-operated locations in the quarter, with 80 featuring Chipotlanes, which are dedicated digital-order pickup lanes. The company maintained its yearly goal of opening between 350 and 370 restaurants.
Chief Executive Scott Boatwright said, “Our positive results reflect the momentum we’re building.” He pointed to new menu items, loyalty program engagement and improvements in restaurant service. MediaRoom
Q2 metric
2025
2026
Change
Food, beverage and packaging expenses
28.9%
29.7%
+80 basis points
Wage costs
24.7%
25.0%
+30 basis points
Additional restaurant expenses
14.0%
14.9%
+90 basis points
Margin at restaurant level
27.4%
25.2%
-220 basis points
Operating profit margin
18.2%
15.7%
-250 basis points
Net profit margin
14.2%
12.1%
-210 basis points
All percentages represent portions of revenue, with the exception of restaurant-level margin.
Higher food expenses were driven by beef, freight, and greater protein consumption. Labor costs rose due to higher wages and performance bonuses. Menu price adjustments and lower avocado prices offered limited offset.
Repurchases helped stabilize the EPS comparison. Using the present adjusted profit with the prior year’s diluted share total yields around $0.31. The stated number, once rounded, was $0.33.
The difference is significant. Despite a rebound in sales, underlying profit growth remains unrecovered. Operating income dropped by 6%, and net income decreased by 7.5%.
First-half cash allocation
2025
2026
Change
Operating cash flow
$1.118 billion
$1.332 billion
+19%
Capital expenditure
$0.305 billion
$0.398 billion
+30%
Operating cash flow minus capital spending
$0.813 billion
$0.934 billion
+15%
Stock buybacks
$0.997 billion
$1.355 billion
+36%
Buybacks as a percentage of cash flow less capex
123%
145%
+22 percentage points
Operating cash flow minus capital expenditures is a straightforward calculation, distinct from the free cash flow that companies report.
Repurchases in the first half were just above operating cash flow. After accounting for capital expenditures, they surpassed cash flow by approximately $421 million.
As of June 30, Chipotle had an additional $1.7 billion approved. This accounted for about 4% of its market capitalization following the close on Wednesday.
A fresh challenge emerged in July, as management reported a slowdown in restaurant traffic following widespread media coverage of a nationwide cyclospora outbreak.
The FDA connected the outbreak to iceberg lettuce from Taylor Farms de Mexico that has been recalled. Chipotle stated that the romaine it uses, sourced from California, was not affected.
Market tape
Price
Change
July 22 closing price
$32.20
—
July 29 closing price
$34.24
+6.3% across five sessions
July 29, 18:01 EDT post-market
$36.25
+5.9% from Wednesday close
View historical price data and after-hours overview.
As of the dateline, standard U.S. markets had finished trading. Nasdaq’s after-hours trading continued, set to close at 20:00 EDT.
The next key sector test arrives on Thursday morning, when Yum! Brands NYSE:YUM posts results at 07:00 EDT. Analysts will watch Taco Bell performance for signs that outbreak concerns may be affecting the broader category.
Risks: July traffic could stay inconsistent. Rising costs for beef, freight and labor may push back margin improvements. EPS support from buybacks gets more difficult if operating profit declines further.
What caused CMG shares to spike following the most recent earnings announcement?
CMG finished regular trading on July 29 at $34.24, up 2.18%. In after-hours action, the latest confirmed quote was $36.29, up a further 5.99%. The rise followed upbeat sales figures, increased customer traffic, and higher guidance for comparable sales. At the same time, the S&P 500 dropped 1.52% amid a broad market selloff, underlining the divergence.
How robust were Chipotle’s results for the second quarter?
Revenue for the second quarter came in at $3.349 billion, up 9.3% year-on-year and ahead of Wall Street’s consensus estimate of about $3.33 billion. Adjusted earnings stood at $0.33 per share, beating consensus by one cent. Comparable sales increased 2.2%, topping LSEG’s prediction of 1.32%. However, GAAP net income dropped 7.5% to $403.5 million from the previous year. The outperformance was modest but widespread.
Is there real improvement in customer traffic and same-store sales?
Comparable sales climbed 2.2%, after a 0.5% rise in the first quarter. Transaction volume rose by 1.0%, and average customer spend increased by 1.2%. The pace reflects more robust growth than price gains alone. Management indicated that momentum at the start of July has tapered off in recent weeks, as consumers act more cautiously. Price contributed 1.6% in the second quarter and is expected to hit the mid-2% range in the third quarter. The recovery appears real but remains delicate.
What continues to put pressure on Chipotle’s profit margins?
Restaurant-level operating margin slipped to 25.2% from 27.4% in the prior year. Company operating margin was also down, coming in at 15.7% compared to 18.2%. Food, beverage, and packaging expenses moved 80 basis points higher to 29.7%. Labor costs rose by 30 basis points to stand at 25.0%. Higher beef and freight costs, along with wage increases, bonuses, and marketing spending, contributed to the margin squeeze. Management anticipates food costs will hover close to 30% and labor costs around the mid-25% level in Q3. Margins remain the main area of weakness.
What commitments are included in management’s raised forecast for 2026?
Management now anticipates comparable sales to grow in the low-single digits, revising its prior expectation for flat growth. Plans remain unchanged for opening 350 to 370 new restaurants in 2026, with 10 to 15 of those operated by international partners. Around 80% of newly owned restaurants by the company are expected to feature Chipotlanes. Menu prices in the third quarter are set to increase towards the mid-2% range. The outlook boost is significant, yet not overly ambitious.
Is it possible for growth to be sustained by new restaurant openings if increases in comparable sales stay limited?
Chipotle finished June with 4,186 company-owned restaurants and 15 operated by partners. In Q2, the company opened 100 company-run restaurants and one partner site. Management indicates new locations deliver productivity close to 80% and achieve roughly 60% cash returns in the second year. Expected 2026 openings represent about 8%-9% of the present restaurant count. Nevertheless, new openings depress existing-location comparable sales by approximately 100 basis points. Revenue may be driven by unit expansion. Flawless execution is still essential.
Is CMG's stock buyback program sufficient to bolster its shares?
Chipotle bought back $630.7 million in shares in Q2 at an average price of $32.55. Total buybacks for the year-to-date surpassed $1.3 billion, with an average cost of $34.35 per share. The company ended the quarter with $1.7 billion still available for repurchase under authorization, equivalent to around 3.7% of the market capitalization at post-market pricing. Chipotle reported $800 million in cash and investments and carries no debt. It also has access to a $500 million revolving credit facility. While buybacks support shares, fundamentals continue to drive the stock’s direction.
Does CMG remain appealingly priced following its surge after earnings?
CMG ended Wednesday at $34.24, trading at nearly 31.4 times its trailing earnings, with a reported forward multiple close to 27.5. Following a post-market rise to $36.29, both ratios moved up. The consensus analyst price target was about $42.94 from 35 projections, indicating potential upside near 18% from the after-hours level. Several of those targets were set before the latest results. While CMG’s valuation is lower than it was last year, it remains far from clearly cheap.
What poses the greatest short-term threat to CMG investors?
Management reported recent sales lost momentum after a period of stronger gains in early July. Broader concerns over cyclospora across the industry have likely reduced traffic at some restaurants. Chipotle noted that its romaine sourced from California was not part of the recent outbreak. However, consumer perception can impact visits even without any direct link. Other pressures include higher costs for beef, freight, labor, as well as tougher comparisons on promotions. Food safety issues continue to be a particularly sensitive topic for the company.
What is a plausible projection for CMG's share price over the next 12 months?
A typical base-case estimate stands at $40 to $44, based on low-single-digit comparable sales and restaurant margins holding around 25%-26%. If customer traffic increases and margins rise above 26%, a bull case pushes the range to $47-$50. In a bear scenario, with flat comps and ongoing inflation, values could dip to $30-$34. Analyst consensus averages roughly $43-$44, with target ranges spanning $35-$55. These figures indicate scenario ranges rather than exact projections. Forecast visibility remains limited following the significant earnings move.
Khadija Saeed is a financial markets reporter at TS2.tech. Her coverage ranges from stocks and technology to emerging industries and developments across global markets. She studied economics and finance at the London School of Economics and worked in market research before becoming a financial journalist. Follow Khadija Saeed on Google News.
Surprising starts and permits data can impact homebuilders, mortgage-sensitive stocks, Treasury yields, and the dollar if results deviate significantly from consensus estimates.
#02
Home Depot Q2
The results and outlook provide key insights into housing turnover, renovation demand, professional customer activity, and U.S. discretionary spending.
#03
09:15 ET industrial production
A robust or disappointing factory or utilities report can shift expectations for economic growth, cyclical stocks, bond yields, and the Federal Reserve’s policy direction.