
NEW YORK, August 4, 2026, 09:07 EDT
- Microsoft shares were down 2.2% at $476.98 in premarket trading on Tuesday.
- With Monday’s closing level, the stock logged a three-day rally of 24.9%, marking its biggest such advance since October 2000.
- The surge boosted equity value by about $722 billion, calculated using reported shares outstanding.
Microsoft shares pointed down 2.2% to $476.98 in premarket dealings. The stock previously finished Monday at $487.65, up 4.93%. Regular U.S. markets were set to open at 09:30 EDT.
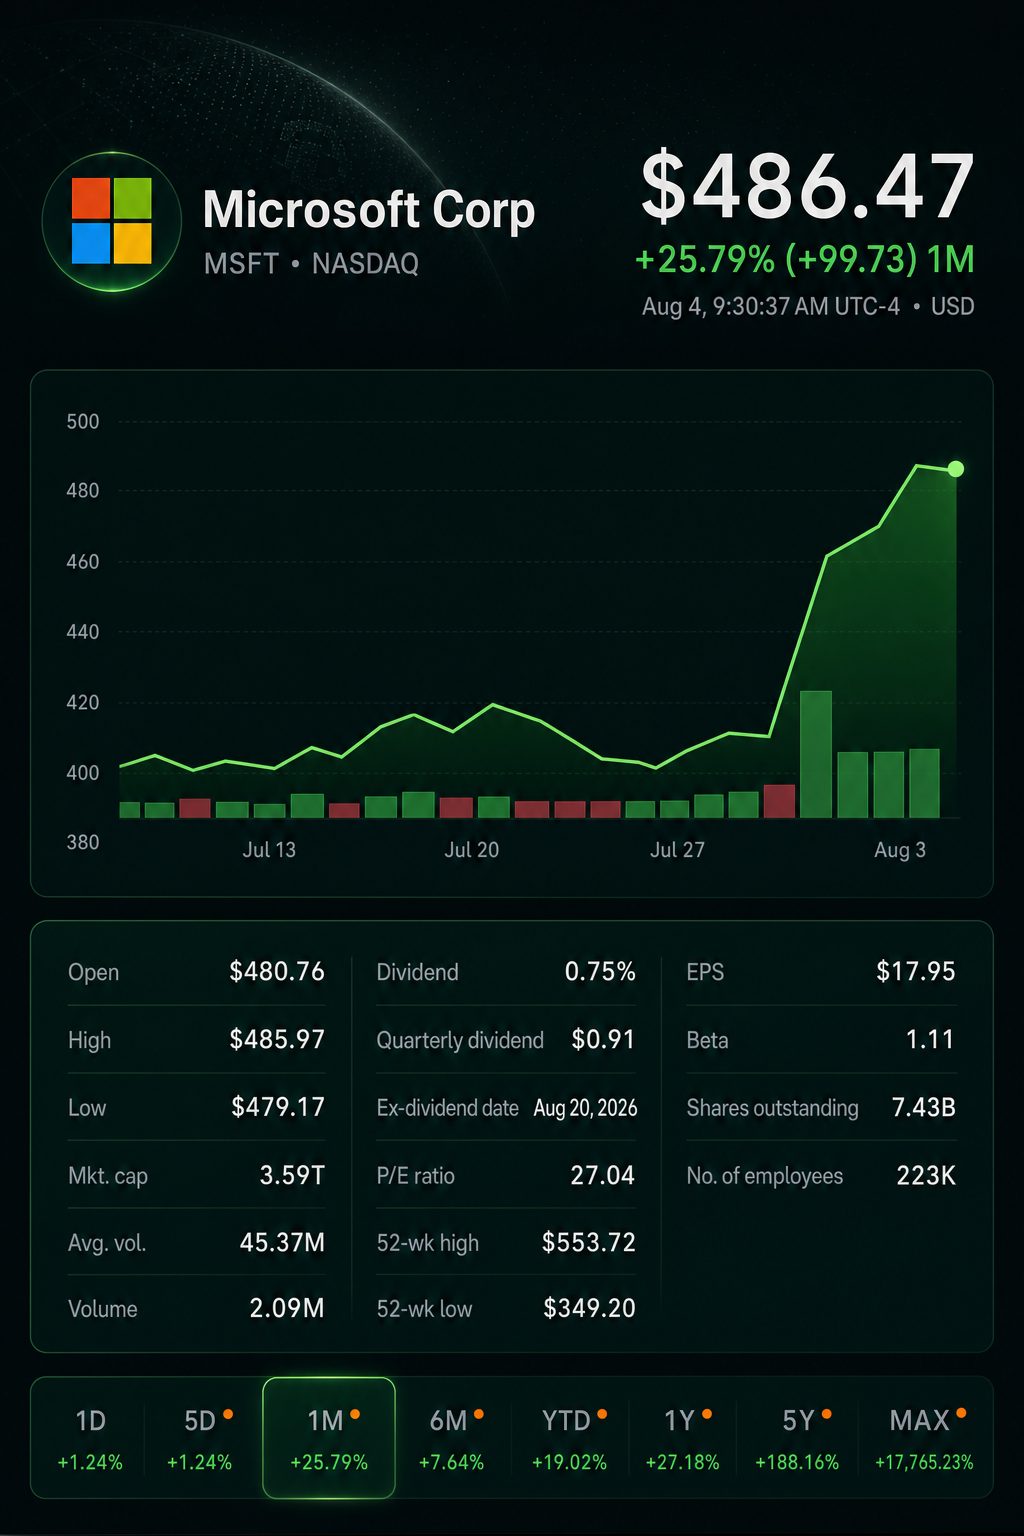
The retreat came after a 24.9% surge over three days, Microsoft’s sharpest gain of this kind since October 2000. Shares in premarket action remained roughly 22.2% higher than the initial calculated point.
The broader narrative is one of several adjustments. With fiscal 2026 earnings unchanged, Microsoft’s basic trailing P/E climbed from 21.8 to 27.2. At $476.98, the ratio was still close to 26.6.
| Valuation stage | Share price | Change from pre-rally | Simple trailing P/E | Approx. equity value |
|---|---|---|---|---|
| Assessed pre-rally value | $390.43 | — | 21.8x | $2.90 trillion |
| Monday session close | $487.65 | +24.9% | 27.2x | $3.62 trillion |
| Tuesday premarket activity, 09:07 EDT | $476.98 | +22.2% | 26.6x | $3.54 trillion |
Projections keep fiscal 2026 GAAP earnings at $17.95 per share, based on 7.43 billion shares outstanding. The initial price is derived from the rounded return over three days.
The three-day rally boosted Microsoft’s market value by approximately $722 billion. A drop before Tuesday’s market open erased about $79 billion from that figure. The overall increase remained close to $643 billion.
The earnings driver was reflected in multiple key metrics. Azure’s growth rate surpassed analyst expectations by three percentage points. Both first-quarter revenue and Azure outlook also exceeded market predictions.
| Reported or guided metric | Microsoft figure | Consensus estimate | Variance |
|---|---|---|---|
| Fiscal Q4 Azure sales increase | 43.0% | 39.98% | +3.02 percentage points |
| Fiscal Q1 revenue, midpoint guidance | $90.40 billion | $89.66 billion | +$0.74 billion |
| Fiscal Q1 constant currency Azure growth | About 45.0% | 40.92% | +4.08 percentage points |
| Fiscal Q4 free cash generation | $19.60 billion | $13.44 billion | +$6.16 billion |
| Fiscal Q4 capital spending | $41.00 billion | $42.37 billion | -$1.37 billion |
The consensus figures reflected analyst projections at the time of the results announcement, rather than Microsoft’s own forecasts.
Chief Executive Satya Nadella stated, “Azure revenue surpassed $100 billion for the first time.” Microsoft 365 Copilot reached more than 30 million paid seats. Microsoft
Visibility into demand also got better. The commercial cloud backlog stood at $678 billion, up by $51 billion from the previous quarter. Microsoft noted this growth was driven by customers beyond top U.S. AI model developers.
| Demand or cash measure | Latest figure | Comparison | Change |
|---|---|---|---|
| Commercial remaining performance obligation | $678 billion | $627 billion previous quarter | Increase of $51 billion, up 8.1% |
| Microsoft 365 Copilot paid seats | Over 30 million | 20 million previous quarter | Risen by more than 50% |
| Quarterly capital expenditure | $41 billion | Year earlier | Greater than 70% increase |
| Quarterly free cash flow | $19.6 billion | Year earlier | Down 23% |
Comparisons for backlog and Copilot are sequential, while changes to capital spending and free cash flow are measured year-on-year.
The division is significant. Capital expenditure increased by over 70%, and free cash flow dropped 23%. Still, free cash flow came in nearly 46% above analyst expectations.
The rerating can be attributed to that mix. Investors responded to secured demand and increased product uptake, even as cash conversion softened. Data indicates Microsoft’s prior AI-investment discount has substantially reduced.
Peer activity reflected a focused rally among cloud firms. Amazon.com NASDAQ:AMZN, Alphabet NASDAQ:GOOGL, and Oracle NYSE:ORCL each gained on Monday.
| Relevant cloud competitor | Closing price Aug 3 | Change on day | Market capitalization |
|---|---|---|---|
| Microsoft NASDAQ:MSFT | $487.65 | +4.93% | $3.63 trillion |
| Amazon.com NASDAQ:AMZN | $284.02 | +4.61% | $3.10 trillion |
| Alphabet NASDAQ:GOOGL | $373.51 | +4.88% | $4.57 trillion |
| Oracle NYSE:ORCL | $141.85 | +9.25% | $0.41 trillion |
Prices and market values are based on the latest regular session figures available prior to Tuesday’s market open.
Dave Wagner from Aptus Capital Advisors said Azure was “staying right there in the race.” His remarks came after rival cloud platforms reported another strong quarter. Reuters
Earlier on Tuesday, market sentiment was stronger. At 06:56 EDT, Nasdaq 100 futures had risen 0.78%, with S&P 500 futures up 0.2%.
Risks: Capital expenditure for the quarter stood at $41 billion. Outstanding data-center lease commitments amounted to $329.1 billion. Any decline in demand might cause the valuation gap to reappear.
The following focus is on execution. Microsoft is projecting Azure’s constant currency growth close to 45% this quarter. Maintaining this rate should justify the revised multiple, while any shortfall would challenge it.
Related articles: NASDAQ:MSFT