
NEW YORK, August 6, 2026, 09:09 EDT
- Shares of Palantir slipped 2.3% to $154.72 ahead of Thursday’s opening bell on the Nasdaq.
- Roughly 90% of the revenue growth in the second quarter came from U.S. customers.
- Midpoint of fiscal 2026 revenue outlook increased by 6.5%.
Palantir shares fell ahead of the 9:30 a.m. market open on Thursday, after a 29.5% jump on Tuesday and a 2.6% drop on Wednesday.
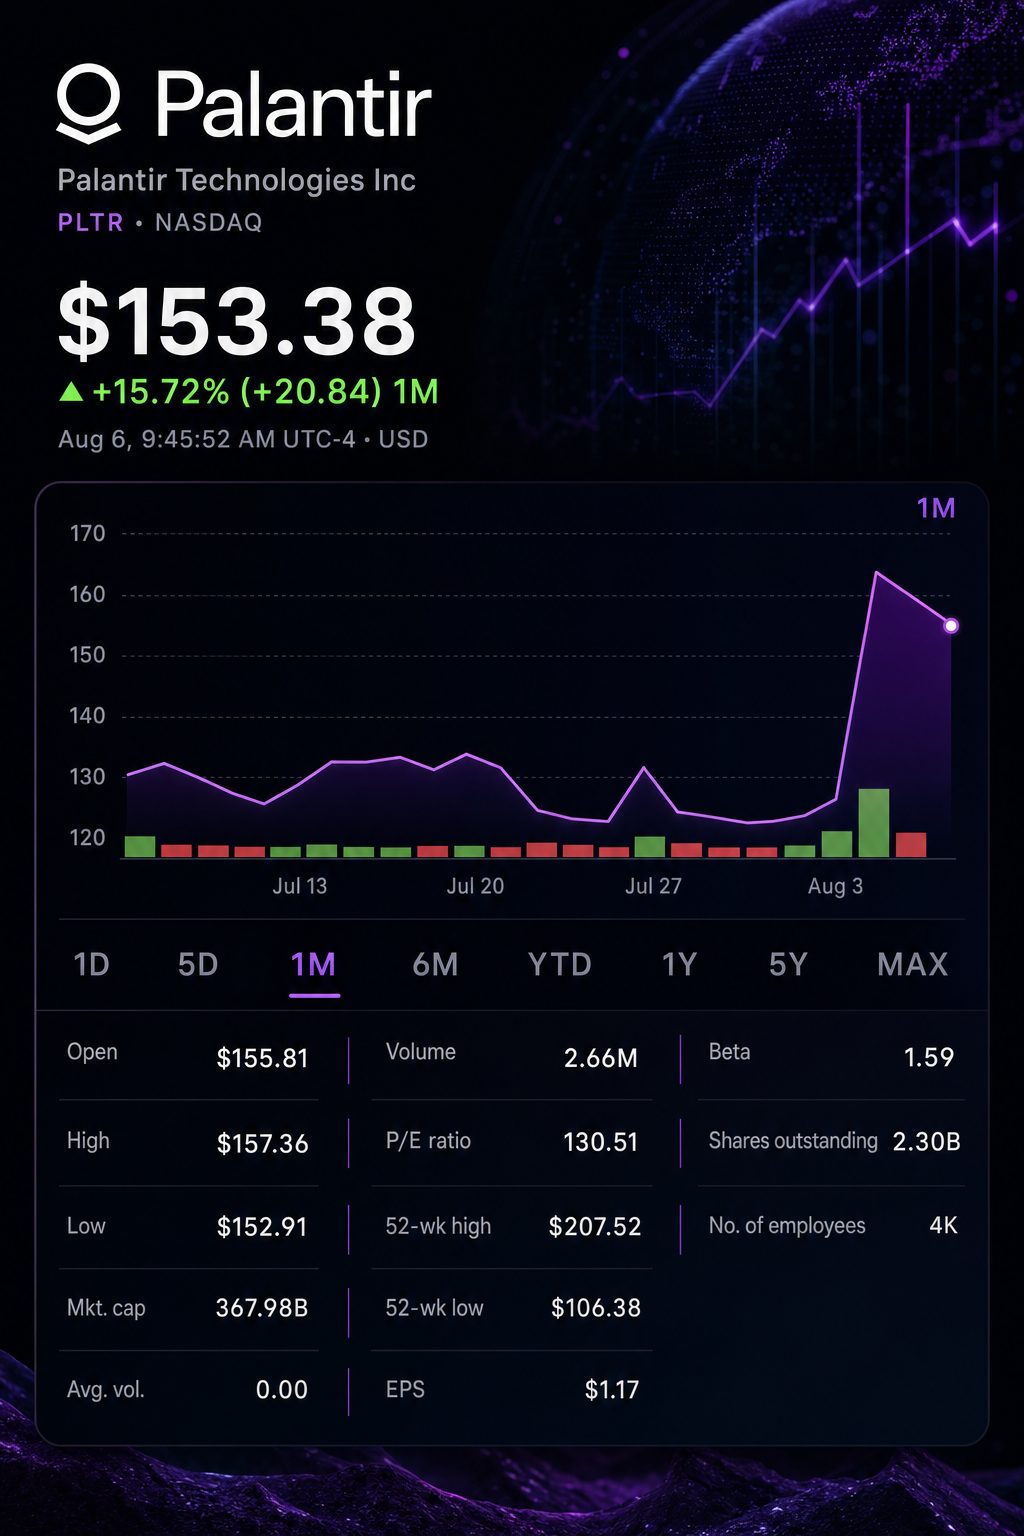
The stock remained roughly 23% higher than its closing price before Monday’s earnings report. This puts investors in a position to balance strong growth with the stock’s already high valuation.
| Session | Price | Session move |
|---|---|---|
| Aug. 3 close, before results | $125.83 | Reference |
| Aug. 4 close | About $162.7 | +29.5% |
| Aug. 5 close | $158.43 | -2.6% |
| Aug. 6, 09:06 premarket | $154.72 | -2.3% |
Information from Reuters and MarketWatch. The price listed for Tuesday reflects the closing change posted on Wednesday.
Palantir’s primary investor focus is reflected in its geographic distribution. About 90% of its revenue growth from one year to the next was generated by U.S. clients.
Total revenue increased by $932 million, reaching $1.935 billion. Company data indicates U.S. sales accounted for approximately $841 million of the gain.
Revenue in the United States climbed to $1.573 billion, marking a 115% increase. U.S. sales accounted for 81.3% of the quarter’s total, compared with approximately 72.9% in the same period last year. Sales outside the U.S. grew by about 33%.
| Revenue geography | Q2 2026 | Q2 2025 estimate | Growth | Share of revenue increase |
|---|---|---|---|---|
| United States | $1.573 billion | About $732 million | +115% | Approximately 90% |
| Outside United States | About $362 million | About $272 million | Roughly +33% | Approximately 10% |
| Total | $1.935 billion | $1.004 billion | +93% | 100% |
Palantir’s approximate U.S. revenue and growth figures are based on its geographic statements.
Growth accelerated for both domestic segments. Revenue from U.S. commercial operations surged 149% to $764 million, and income from U.S. government business increased 90% to $809 million.
Further evidence came from bookings. Palantir secured 220 contracts each valued at $1 million or more. Of these, 73 contracts surpassed $10 million. The overall contract value increased by 49% to $3.373 billion.
Profit growth outpaced revenue. GAAP operating income rose to over three times its previous level, and adjusted free cash flow increased by more than twofold.
| Operating measure | Q2 2026 | Q2 2025 | Change |
|---|---|---|---|
| Revenue | $1.935 billion | $1.004 billion | up 93% |
| GAAP operating income | $912 million | $269 million | rise of 239% |
| Adjusted operating margin | 62% | 46% | increase of 16 points |
| Adjusted free cash flow | $1.220 billion | $569 million | up 115% |
| Stock-based compensation | $265 million | $160 million | up 66% |
Adjusted figures do not account for stock-based compensation or the corresponding employer payroll taxes.
Chief Executive Alex Karp described the quarter as “otherworldly.” He stated the company was “compounding at a rate and scale” not seen before. SEC
Management increased its full-year revenue outlook by $498 million at the midpoint. The company’s third-quarter midpoint is also 8.1% higher than the LSEG consensus referenced by Reuters.
| Outlook measure | New figure | Comparison | Difference |
|---|---|---|---|
| Q3 revenue midpoint | $2.162 billion | $2.000 billion consensus | +8.1% |
| 2026 revenue midpoint | $8.154 billion | $7.656 billion prior guide | +$498 million, or 6.5% |
| 2026 U.S. commercial floor | $3.424 billion | $3.224 billion prior floor | +$200 million |
| Preliminary implied Q4 revenue | $2.424 billion | $1.407 billion in Q4 2025 | About +72% |
The Q4 number represents a midpoint estimate, based on first-half results and Q3 guidance. This is not an official company forecast.
The calculation suggests growth slows from 93% in Q2 to approximately 83% in Q3, and then to around 72% in Q4. Such growth rates are uncommon, but the trend is significant for Palantir’s valuation.
Palantir ended Wednesday with a market capitalization close to $380 billion. The company’s trailing price-to-earnings ratio stood around 135. Based on the most recent four quarters, its market value was approximately 62 times its trailing revenue.
Opinions on Wall Street are highly mixed. According to Google Finance, there are 16 Buy ratings, four Hold ratings, and two Sell ratings. The consensus price target stands at $197.21, with projections spanning from $80 to $255.
| Firm and analyst | Recommendation | Action | Target | Date |
|---|---|---|---|---|
| Bank of America NYSE:BAC, Mariana Perez Mora | Buy | Reiterated | $255 | Aug. 5 |
| Citigroup NYSE:C, Tyler Radke | Buy | Maintained | $245 | Aug. 5 |
| Piper Sandler NYSE:PIPR, Clarke Jeffries | Buy | Reaffirmed | $230 | Aug. 4 |
| UBS Group NYSE:UBS, Karl Keirstead | Buy | Maintained | $220 | Aug. 4 |
| Morgan Stanley NYSE:MS, Sanjit Singh | Hold | Maintained | $205 | Aug. 4 |
| Deutsche Bank NYSE:DB, Brad Zelnick | Buy | Upgraded | $200 | Aug. 4 |
| Cantor Fitzgerald, Thomas Blakey | Hold | Reaffirmed | $156 | Aug. 3 |
| Royal Bank of Canada NYSE:RY, Rishi Jaluria | Sell | Maintained | $90 | Aug. 3 |
| Jefferies Financial Group NYSE:JEF, Brent Thill | Sell | Maintained | $80 | Aug. 3 |
The table shows a selection of recent actions from the 22-analyst dataset provided by Google Finance.
Emarketer analyst Jacob Bourne referred to Palantir as “the clearest counterexample” to skepticism over whether enterprise AI can succeed at scale beyond initial pilots. Cantor’s Blakey said it is “a leading beneficiary of secular AI growth trends.” Reuters
Jefferies kept a cautious stance, favoring Microsoft Corp. NASDAQ:MSFT, Amazon.com Inc. NASDAQ:AMZN and Snowflake Inc. NYSE:SNOW for AI exposure. The broker cited Palantir’s valuation and weaker global growth as reasons for its preference.
Palantir’s strong focus on the U.S. market brings both advantages and risks. The company’s recent filing cautions that higher reliance on U.S. revenue heightens vulnerability to domestic policy and economic changes. Government contracts may also be postponed or canceled due to budgetary decisions.
Risks: Key concerns include heavy U.S. exposure, possible changes in government expenditure, a deceleration in growth abroad, and potential compression of valuation multiples. Additionally, stock-based compensation climbed by 66%, outpacing the increase in operating costs.
Related articles: NASDAQ:PLTR



![Asia Stock Market Today 27/08/2026 [UPDATE: 00:10 SGT] [Chip Losses Narrow as KASE Global Enters Final Hour]](https://ts2.tech/wp-content/uploads/2026/08/Asia-market-dashboard-2026-08-27-0010-480x384.jpg "Asia Stock Market Today 27/08/2026 [UPDATE: 00:10 SGT] [Chip Losses Narrow as KASE Global Enters Final Hour]")