
SINGAPORE, August 1, 2026, 06:04 SGT
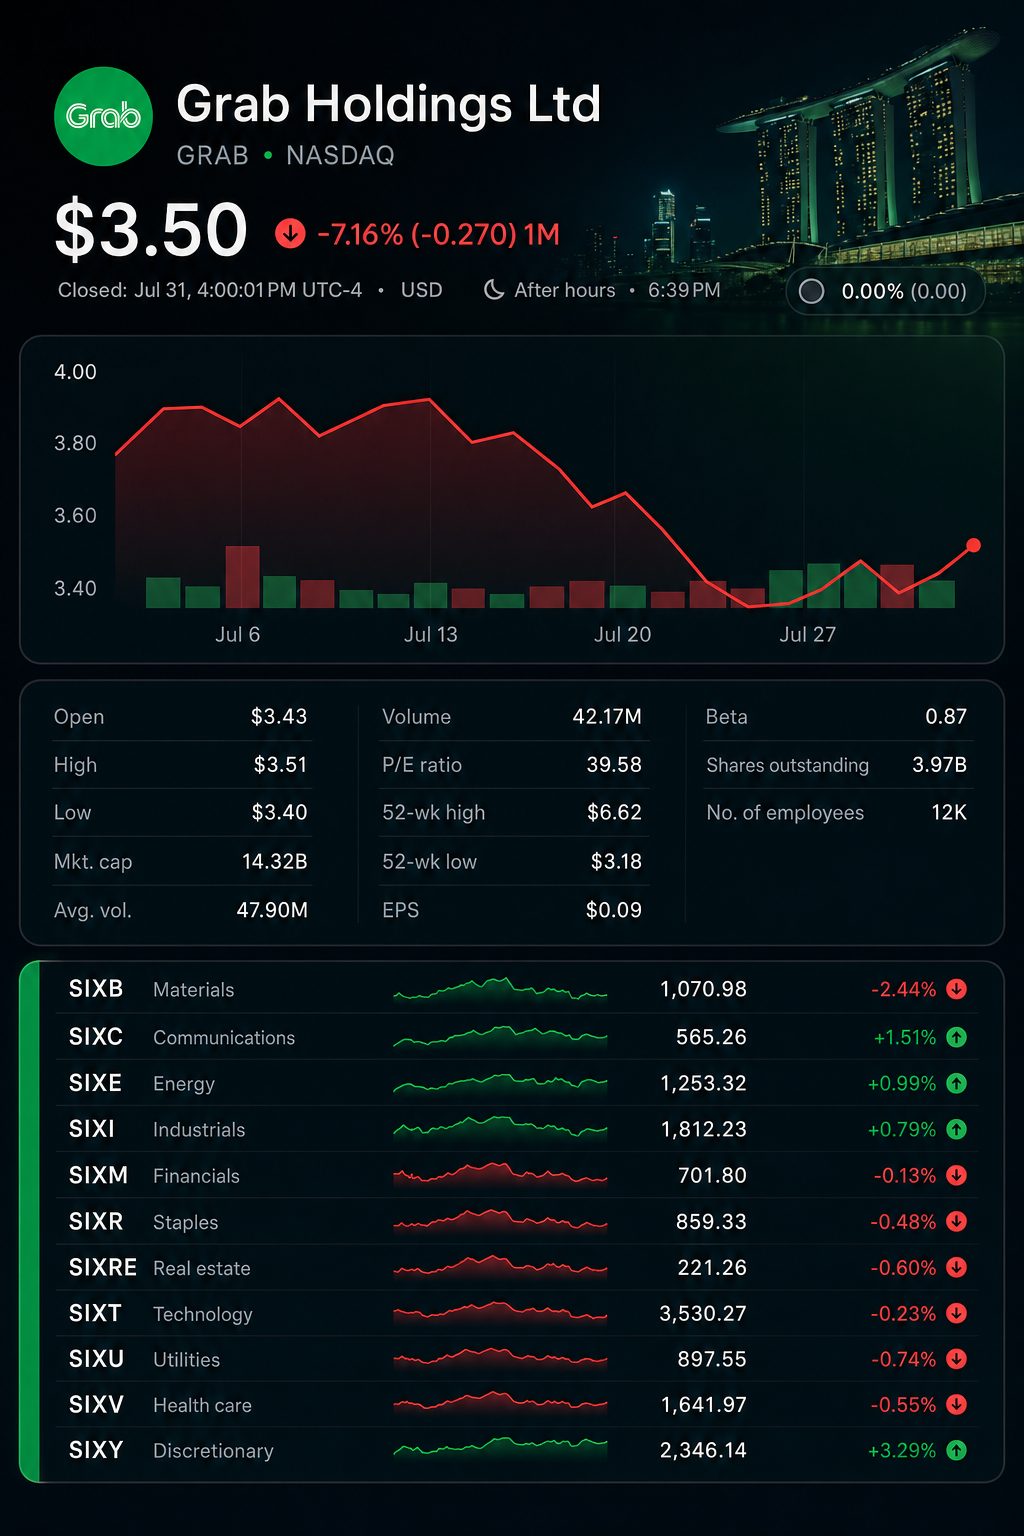
- Grab ended Friday at $3.50, an increase of 2.9%. Over the week, shares rose 5.7%.
- Second-quarter revenue is projected to be between $990.36 million and approximately $1 billion.
- Financial services may contribute 42% to 54% of quarter-over-quarter revenue growth, despite making up roughly 13% of total sales.
Grab’s financial services division could account for between 42% and 54% of its sequential revenue increase in the second quarter. However, this business is expected to make up just approximately 13% of the company’s overall sales.
The margin for fintech is a more stringent measure of earnings. The segment reported a $17 million loss in adjusted EBITDA for the first quarter. Its gross loan book climbed 130% to reach $1.44 billion.
Mobility is expected to contribute little additional support. The initial estimate stands at $338.2 million, just exceeding Q1’s $337 million figure. Deliveries could see a slightly greater increase of $26.3 million.
The second quarter is the final clear pre-Stash reference point. Grab closed its digital-finance purchase on July 1. From the next period, results will reflect both the new business and associated integration expenses.
U.S. markets had closed before the dateline. Grab traded flat in after-hours at $3.50. Despite last week’s bounce, the stock stayed close to its lowest level of the year.
| Market reference | Latest reading | Comparison |
|---|---|---|
| Friday close | $3.50 | Gained 2.9% on Friday |
| July 24 close | $3.31 | Rose 5.7% during the week |
| 52-week low | $3.18 | Friday close finished 10.1% above |
| 52-week high | $6.62 | Friday close ended 47.1% lower |
| Friday volume | 42.12 million | Stands at 88.0% of visible average |
Turnover stayed under the shown 47.90 million average. The price increased but turnover did not spike.
The revenue comparison highlights potential areas for growth. Q2 2026 numbers listed below are consensus estimates pending finalization.
| Revenue, $ millions | Q2 2025 actual | Q1 2026 actual | Q2 2026 preliminary estimate | Sequential change |
|---|---|---|---|---|
| Group | 819 | 955 | 990.4–1,000.0 | 35.4–45.0 |
| Deliveries | 439 | 510 | 536.3 | 26.3 |
| Mobility | 295 | 337 | 338.2 | 1.2 |
| Financial services | 84 | 107 | 126.0 | 19.0 |
Financial services contributed approximately $19 million more compared to Q1, accounting for 42% of the upper group growth and 54% relative to the lower consensus estimate.
Mobility contributes just around $1 million, increasing the emphasis on lending and deliveries. Grab aims for its financial-services segment to reach EBITDA breakeven in the second half of 2026.
The sales target seems attainable given present guidance. The following calculation relies on the latest Q2 consensus estimate of $990.36 million. This reflects straightforward pacing, rather than any quarterly projections from the company.
| 2026 revenue scenario | Full-year forecast | Revenue needed for H2 | Mean Q3-Q4 turnover | Q2 consensus rise |
|---|---|---|---|---|
| Low | $4.040 billion | $2.095 billion | $1.047 billion | 5.8% |
| Midpoint | $4.070 billion | $2.125 billion | $1.062 billion | 7.3% |
| High | $4.100 billion | $2.155 billion | $1.077 billion | 8.8% |
For the midpoint, the average for Q3 and Q4 needs to reach $1.062 billion, marking a 7.3% rise over the present Q2 projection. Seasonal trends could impact this trajectory.
The profit challenge has grown. In the first quarter, adjusted EBITDA totaled $154 million. Grab maintains its 2026 guidance at $700 million to $720 million.
| 2026 adjusted EBITDA scenario | Annual outlook | Needed in Q2-Q4 | Quarter average | Gain compared with Q1 |
|---|---|---|---|---|
| Low | $700 million | $546 million | $182 million | 18.2% |
| Midpoint | $710 million | $556 million | $185 million | 20.3% |
| High | $720 million | $566 million | $189 million | 22.5% |
With half the year completed, the next three quarters will need to average nearly $185 million each—an increase of 20.3% compared with the first quarter. Chief Financial Officer Peter Oey said first-quarter results have kept Grab “firmly on track” to meet its yearly goals. Grab
That confidence is still subject to a cost evaluation. On-demand incentives accounted for 10.5% of GMV in the first quarter. Regional corporate expenses rose by $28 million to reach $114 million.
PT GoTo Gojek Tokopedia Tbk IDX:GOTO has established a new benchmark in the region. The company’s Q2 fintech adjusted EBITDA jumped over fivefold, reaching 481 billion rupiah. For the first time, this figure surpassed its on-demand EBITDA. Although the figures are not exactly equivalent, the development increases expectations for Grab’s fintech transparency.
Grab will release results following the close of U.S. markets on Monday, August 3. The management call begins at 8 p.m. ET, corresponding to 8 a.m. SGT on Tuesday. Investors are focused on fintech losses, credit quality, incentive levels and any updates to guidance.
Risks: Fast expansion in lending may increase credit losses. Starting July 1, Indonesia reduced Grab’s commission for motorcycle drivers to 8% from the previous 20%. Spending on fuel support, incentives, and integrating Stash could further delay improvements in margins.
Related articles: NASDAQ:GRAB