
MOUNTAIN VIEW, California, August 28, 2026, 09:30 EDT
- SentinelOne was last at $21.36 in premarket trading, falling 5.94%, with roughly 213,000 shares changing hands.
- Revenue for the quarter climbed 21% to $292 million, while ARR grew 22% to $1.218 billion.
- The midpoint for adjusted EPS in the fiscal year declined by 11%, even though revenue and operating income projections were raised.
- The non-GAAP operating margin hit 10%, as GAAP net loss stayed at $93 million.
Shares of SentinelOne declined 5.94% in premarket trading on Friday following a mixed earnings forecast. Robust growth in recurring revenue did not counterbalance the company cutting its full-year profit outlook.
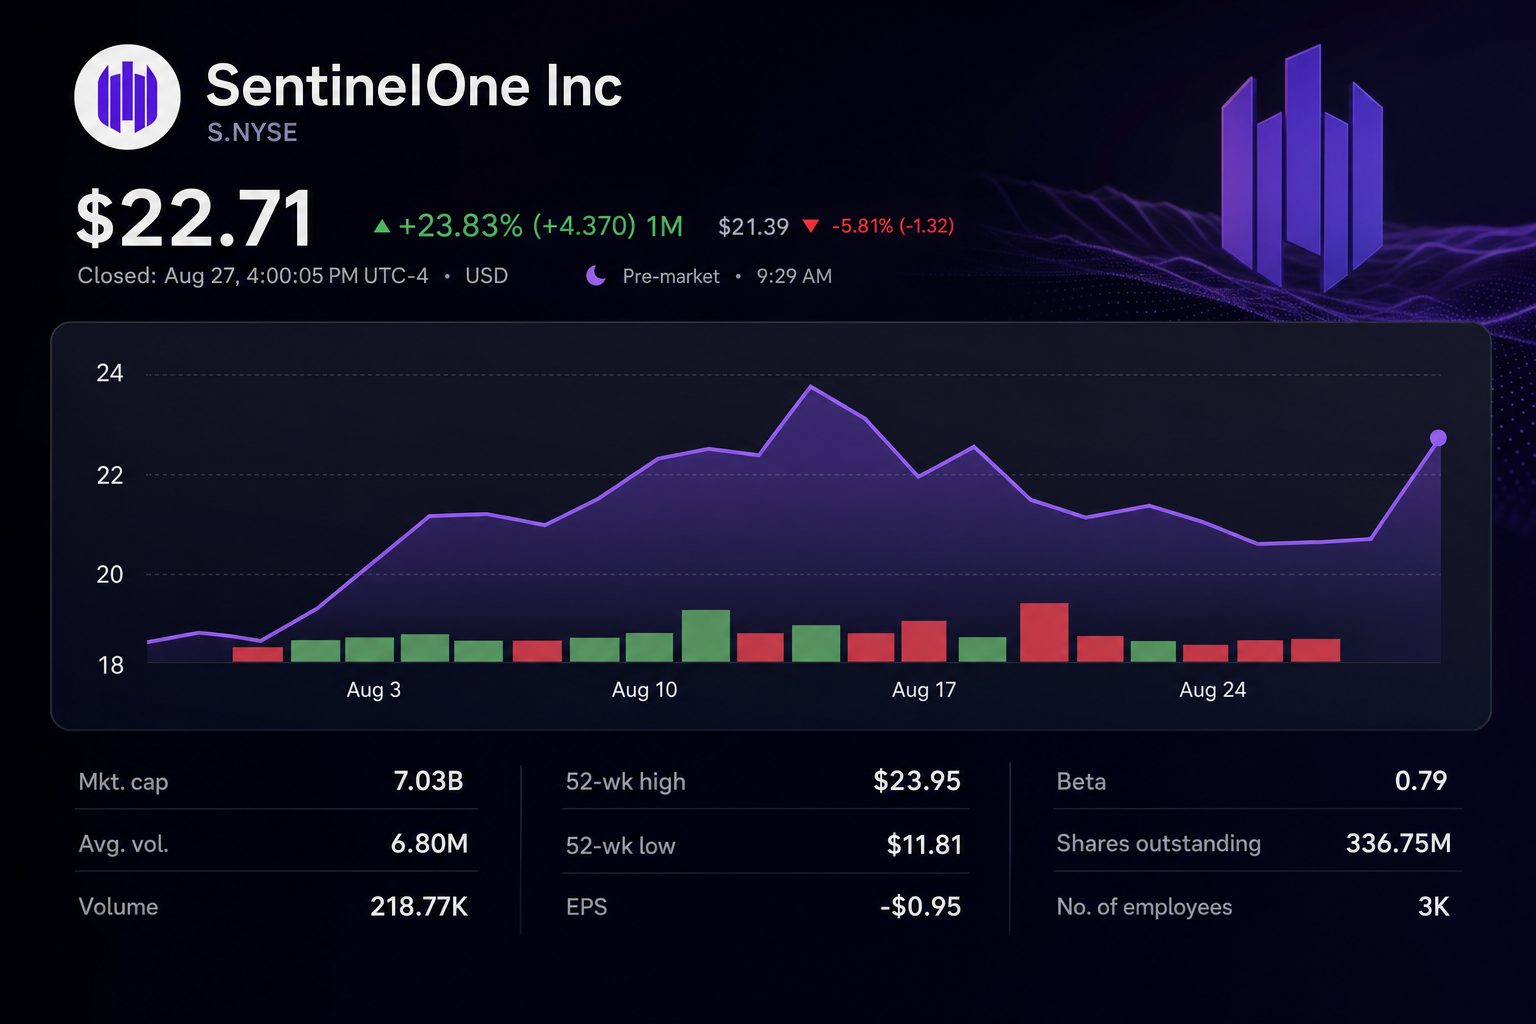
At 09:30 EDT, the stock was trading at $21.36, with trading volume near 213,000 shares. The drop of $1.35 wiped out around $455 million in implied equity value.
The main pressure lies beneath the top-line figure. SentinelOne, Inc. (NYSE: S) increased both its revenue and operating income projections. However, its adjusted EPS midpoint declined to $0.31 from $0.35.
| Investor metric | Q2 FY2027 / new outlook | Comparison |
|---|---|---|
| Revenue | $292 million | Gains 21%; $290.2 million estimate |
| ARR | $1.218 billion | Increases 22% |
| Non-GAAP operating margin | 10% | 2% in the previous year |
| GAAP gross margin | 72% | 75% year-ago period |
| FY revenue guide | $1.202 billion–$1.207 billion | Prior range: $1.195 billion–$1.205 billion |
| FY adjusted EPS | $0.30–$0.32 | Earlier range was $0.32–$0.38 |
Revenue for the fiscal second quarter was $292 million, surpassing consensus expectations. Adjusted EPS rose to $0.08, outperforming the $0.07 forecast.
Annualized recurring revenue climbed 22% to reach $1.218 billion. The number of customers generating $100,000 or more in ARR grew by 13% to 1,715. These numbers bolster the argument for platform expansion.
Adjusted profitability rose significantly. The non-GAAP operating margin increased by eight percentage points to reach 10%. The adjusted net income margin also doubled, hitting 10%.
GAAP financials continued to be soft. Gross margin decreased by three points to 72%. SentinelOne reported a net loss of $93.4 million, representing 32% of its revenue.
Management projects third-quarter revenue between $309 million and $311 million, with the midpoint aligning with Wall Street’s $310 million forecast. Adjusted EPS is expected to be in the range of $0.08 to $0.09, falling short of the current consensus of $0.10.
SentinelOne now expects full-year revenue in the range of $1.202 billion to $1.207 billion. Adjusted operating income guidance was lifted to between $124 million and $128 million.
The profit-per-share outlook continued to fall. Projected diluted shares rose to 361 million from 350 million. The larger share count contributes to the difference between growth in operating income and earnings per share.
Total cash, equivalents and investments stood at $813 million. Free cash flow for the second quarter was minus $13.2 million. The balance sheet stays strong, yet ongoing attention to cash conversion is required.
FactSet shows a consensus rating of Overweight. Of the analysts tracked, 22 have a Buy or Overweight recommendation for the shares, while 16 rate them as Hold. The mean price target stands at $22.98, representing an increase of approximately 8% from the current premarket level.
Risks: Quicker uptake of AI-security may push ARR and margins higher than expected. Valuation could face headwinds from competitors, reduced gross margins, dilution, and ongoing GAAP losses.
The next measure is operating leverage. Investors seek recurring growth to result in increased earnings per share, rather than solely improved adjusted margins.