
MOUNTAIN VIEW, California, August 27, 2026, 16:34 (ET)
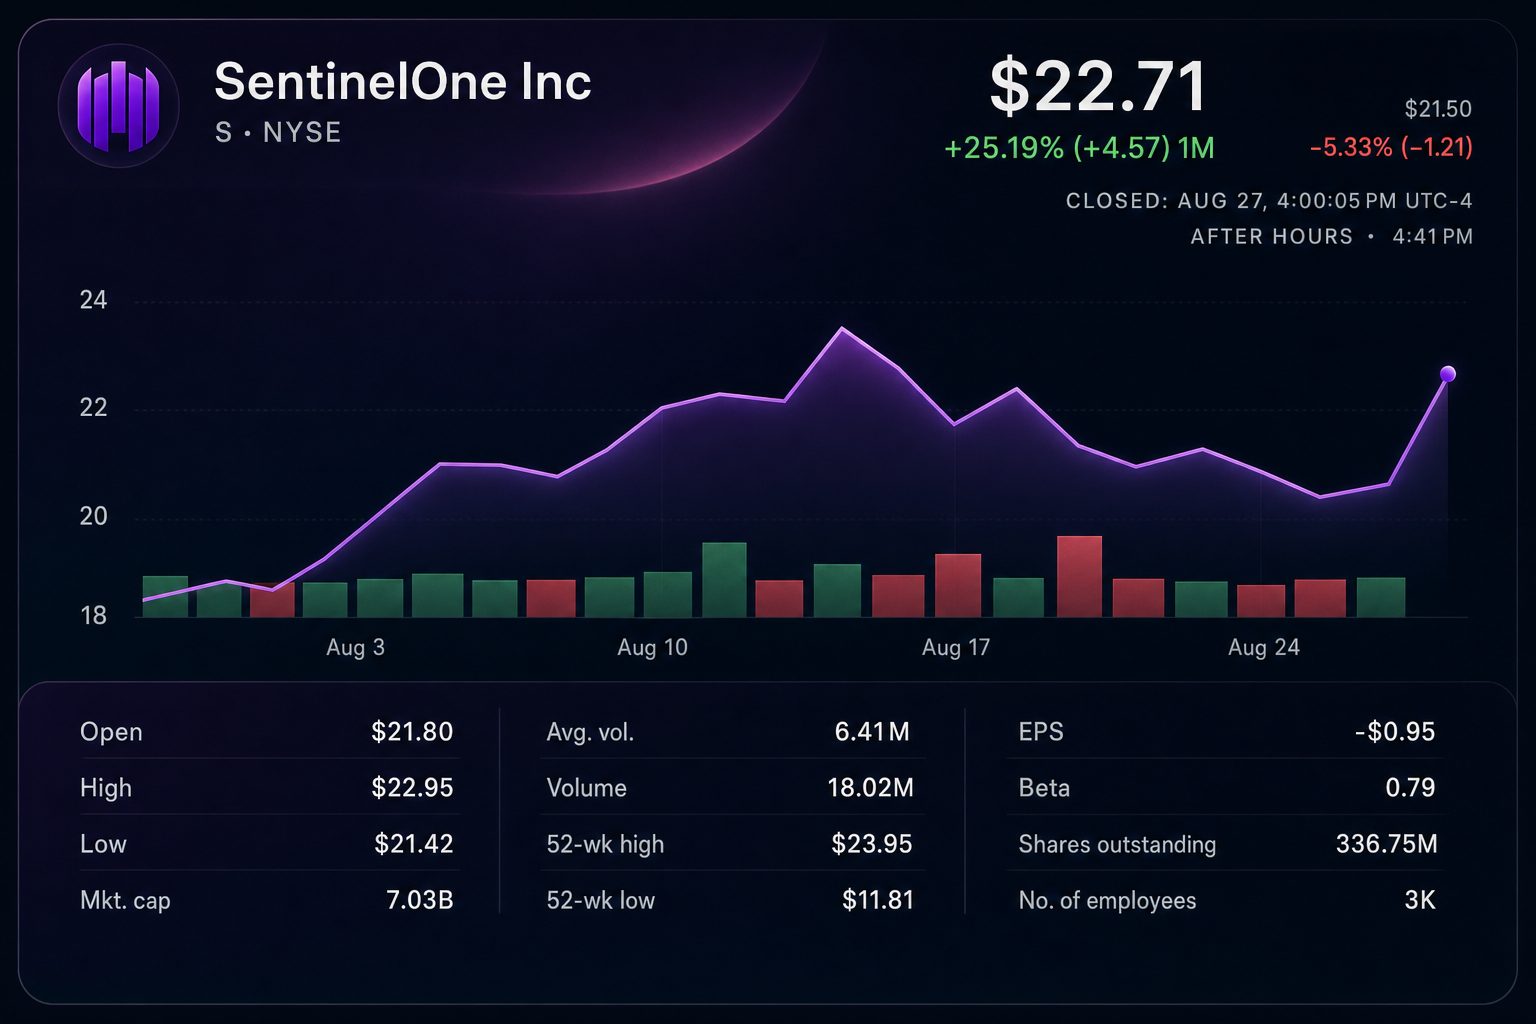
- SentinelOne was last at around $22.00 in after-hours trading, falling 3.1% from its closing price of $22.71.
- Revenue for fiscal Q2 climbed 21% to $292 million, while ARR grew 22% to $1.218 billion.
- The midpoint for fiscal-year revenue increased by $4.5 million, while the adjusted EPS midpoint decreased by four cents.
SentinelOne, Inc. (NYSE: S) dropped roughly 3.1% in after-market trade on Thursday, coming after the stock surged 10.5% during the regular session to close at $22.71.
The reversal highlighted conflicting signals within otherwise robust results. Revenue and operating income forecasts increased, but the adjusted earnings guidance tightened to a lower range.
Shares hovered close to $22.00 as of 16:34 ET. They remained around 7.1% higher than Wednesday’s $20.55 closing price, but the company’s market capitalization was about $240 million less than Thursday’s closing value.
Revenue for the fiscal second quarter was $292 million, marking a 21% increase compared to the previous year. Annualized recurring revenue climbed 22% to $1.218 billion company results.
Adjusted earnings rose twofold to eight cents a share. The non-GAAP operating margin widened to 10% from 2%, reflecting a significant increase in operating leverage.
| Metric | Previous outlook | New result/outlook | Change |
|---|---|---|---|
| Q2 revenue | $289M-$291M | $292M actual | $1M over the upper end |
| FY2027 revenue | $1.195B-$1.205B | $1.202B-$1.207B | Midpoint up by $4.5M |
| FY2027 operating income | $115M-$125M | $124M-$128M | Midpoint increased by $6M |
| FY2027 adjusted EPS | $0.32-$0.38 | $0.30-$0.32 | Midpoint down $0.04 |
The cut to earnings is significant as dilution has grown. SentinelOne is projecting 361 million diluted shares for fiscal 2027, compared to 350 million in its May forecast.
The 3.1% increase in share count offsets a portion of the operating income growth. Despite a 5% rise in the operating income midpoint, the midpoint for EPS drops by 11.4%.
Customer quality held steady. Accounts with annual recurring revenue of $100,000 or more rose by 13% to reach 1,715. Cash and investments totaled $813 million.
Gross margin acted as an offset. Non-GAAP gross margin slipped by two points to 77%, indicating that investments in infrastructure and product are still reflected in unit economics.
Chief Executive Tomer Weingarten said the platform was seeing faster adoption. He linked demand to AI security and the safeguarding of AI workloads.
The stock faced high expectations ahead of its results. On Thursday, 17.9 million shares changed hands, roughly 2.7 times higher than the average volume of 6.6 million market snapshot.
Analyst outlook is positive, though not universal. Robinhood’s data indicates 58% Buy ratings, 40% Hold, and 3% Sell among 38 analyst reviews.
Risks: After-hours prices may fluctuate rapidly due to low liquidity. Increased competition, reduced gross margins, and a higher diluted share count might counterbalance accelerated ARR growth.
The upcoming milestone will be third-quarter performance. Management forecast revenue between $309 million and $311 million, with adjusted EPS projected at eight to nine cents.
Related articles: Earnings