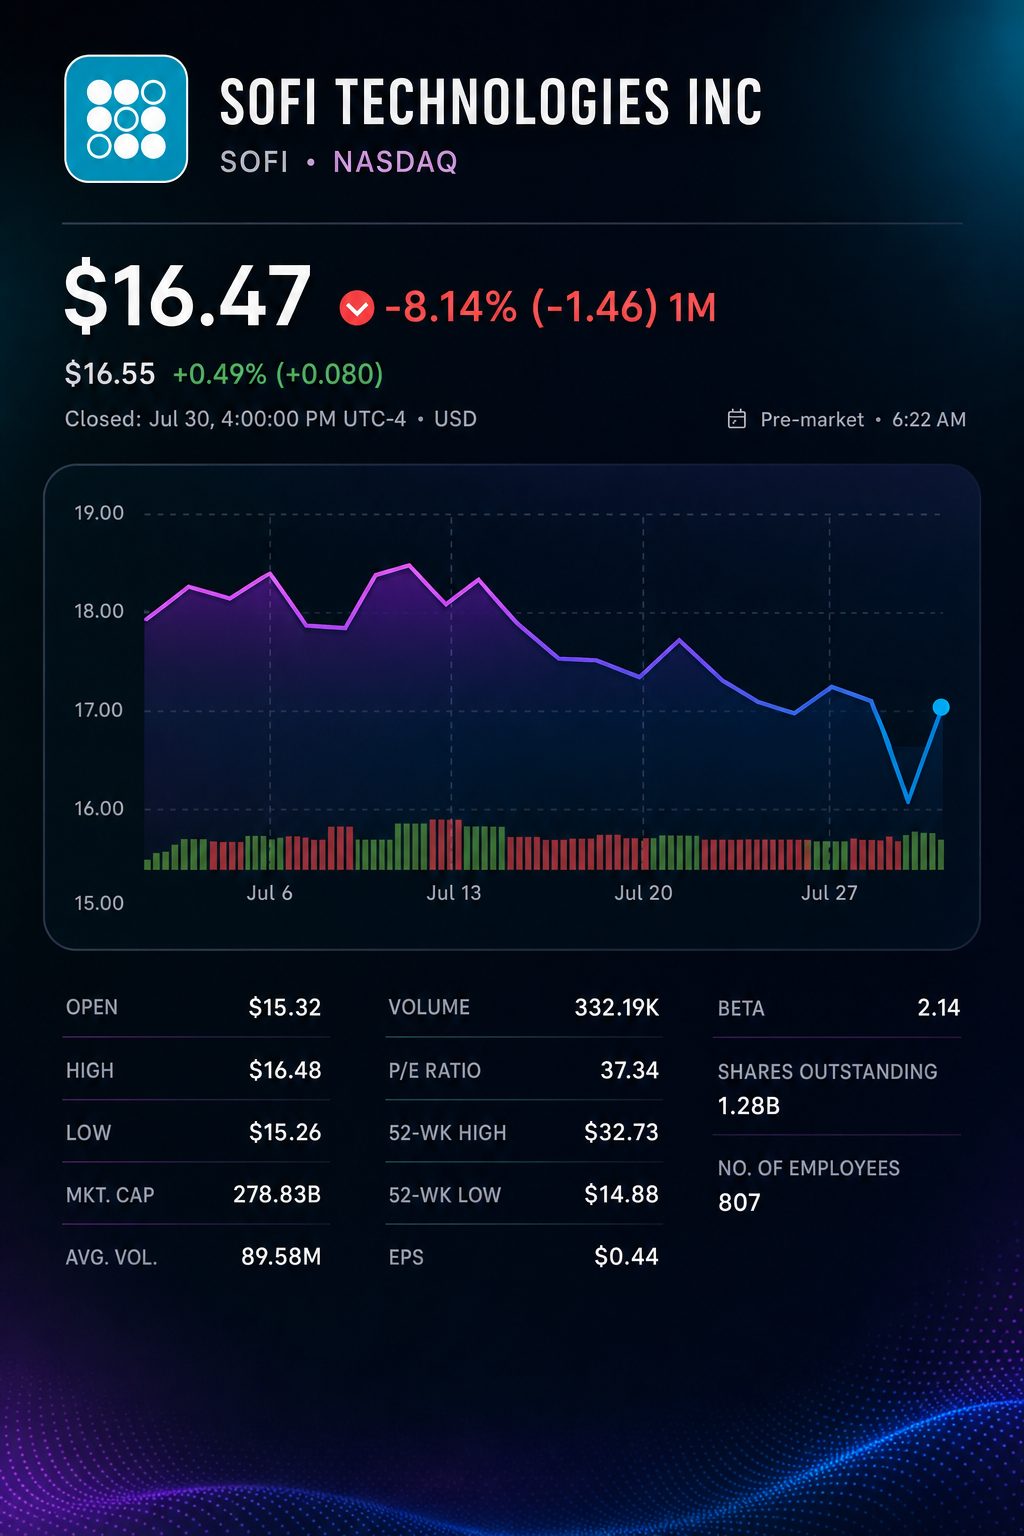
SoFi Technologies, Inc. NASDAQ:SOFI gained 0.1% to reach $16.49 in early trade on Friday, after bouncing back 8% during Thursday’s session. Shares were still trading 1.6% below their closing level prior to Tuesday’s results.
The primary investor signal remains in an unaltered profit outlook. Chief Financial Officer Chris Lapointe stated that the projection would be 65 cents using the previous tax assumption. The official adjusted guidance stays at 60 cents.
A provisional estimate shows the tax-normalized uplift at 8.3%. However, official targets call for a significantly higher rate of profit conversion in the second half.
With a revenue midpoint of $4.80 billion, second-half sales must increase by 9.4% from the first half. Adjusted net income is required to grow by 52.2%, and EBITDA must rise 29.3%.
Full-year bridge
First half reported
Second half implied*
Change versus first half
Adjusted net revenue
$2.293 billion
$2.507 billion
+9.4%
Adjusted EBITDA
$697.7 million
$902.3 million
+29.3%
Adjusted net income
$327.1 million
$497.9 million
+52.2%
EBITDA margin
30.4%
36.0%
+5.6 points
Adjusted net-income margin
14.3%
19.9%
+5.6 points
Initial figures are based on disclosed results for the first half and the midpoint of ongoing guidance.
The stock’s movement over two sessions reflected that uncertainty. On Wednesday, shares dropped 8.9% with volume at 2.4 times the average. Most of that decline was reversed on Thursday, even as the S&P 500 rose 1.66%.
The quarter surpassed key operating challenges. Adjusted revenue was roughly 7.6% above consensus. Adjusted earnings topped forecasts by one cent per share.
Initial market focus was on the unchanged headline. TD Cowen noted that the outperformance was “tempered by the fact that the company maintained full-year EPS guidance.” Reuters
The warning had merit. SoFi increased its revenue midpoint by $145 million, while keeping all three profit targets the same.
Lapointe stated there are “too many large, attractive growth areas” for near-term profits to rise. He said those investments will be supported by incremental revenue. As a result, margins in the second half will be critical. Q4 Capital
The quality of revenue saw an uptick, but there was also greater usage of the balance sheet. Fee income increased by 22% quarter-on-quarter to $472.3 million, accounting for 39% of all revenue. Assets climbed by $7.2 billion, largely due to a $5.8 billion rise in loans.
Funding remained steady. Deposits increased by $5.3 billion, reaching $45.5 billion. Net interest margin climbed four basis points to 5.98%. Estimated annualized personal-loan losses, not counting late-stage delinquent sales, improved to 3.7%.
Technology Platform continued to underperform, with revenue dropping 23% to $84.5 million. Contribution margin decreased to 14% from 30% following the loss of a significant client.
Following Thursday’s close, the official EPS outlook suggested a multiple of 27.5 times adjusted earnings. Adjusting for taxes to 65 cents per share brings that multiple down to 25.3 times. The price to tangible book ratio stood at 2.24 times. All figures are preliminary estimates.
SoFi declined 4.7% in the previous full week, dropping from $17.28 to $16.46. Through Thursday this week, the stock remained largely flat.
Risks: Fast loan expansion heightens vulnerability to consumer credit and fair-value assessments. Delays in shifting fees, rising funding expenses, or ongoing platform softness could put pressure on the necessary margin improvement.
The Nasdaq cash market remained closed. Investors are set to evaluate if Thursday’s rebound persists when post-earnings predictions stabilize next week. SoFi announced that its second-quarter 10-Q is expected in August.
On which exchange is SOFI listed, and how does its performance compare to key indexes?
SOFI last traded at $16.47, following an 8.0% jump on Thursday. The company’s market value stood at around $22.7 billion. Shares remain down roughly 36% in 2026. In comparison, the Nasdaq Composite has climbed 8.1%, while the S&P 500 is up 8.6%. This puts SoFi’s performance about 44 percentage points behind those benchmarks.
Were SoFi’s second-quarter earnings truly above Wall Street forecasts?
The company exceeded expectations by significant margins. Adjusted revenue was $1.206 billion, above the $1.12 billion consensus estimate. Adjusted earnings came in at $0.12 per share, topping forecasts by a cent. GAAP net income rose 61% to $156.6 million. Adjusted EBITDA grew 44% to $357.8 million, resulting in a 30% margin.
What caused the share price to decline even with those solid results?
SoFi updated its revenue outlook to a higher range, while keeping profit projections steady. Adjusted EPS guidance remained at $0.60, and the company reaffirmed its EBITDA forecast at around $1.6 billion. Shares slid roughly 9% in early trading on Wednesday. Investors expressed concerns over growth quality and ongoing Technology Platform challenges. An 8% rise on Thursday recouped much of the previous loss, though some decline persisted.
What does SoFi need to achieve in the second half to reach its guidance targets?
Adjusted revenue for the first half stood at $2.293 billion. The midpoint of the full-year guidance, set at $4.80 billion, implies the need for $2.507 billion in the latter half. Adjusted EBITDA in the first half was $697.7 million. Achieving the $1.6 billion goal means generating about $902 million more, representing a 36% margin. While the target seems within reach, most of the progress must come later in the year.
Can SoFi maintain its pace of lending growth, or is it exposing its balance sheet to too much risk?
Total originations jumped 69% to an all-time high of $14.8 billion. Personal loan originations totaled $10.7 billion, with $3.1 billion generated for third parties. Originations for student and home loans came to $2.7 billion and $1.4 billion, respectively. Lending revenue climbed 63% to $724.8 million, accounting for nearly 59% of overall company revenue. Although the third-party channel provides support, SoFi remains significantly exposed to consumer credit.
Is SoFi seeing a real improvement in its consumer credit losses?
The annualized charge-off rate for personal loans was reported at 2.62%, down from 3.03%. The figure is impacted by asset sales, new originations, and delinquency sales. Excluding late-stage delinquency sales, management puts the all-in rate at around 3.7%. Student-loan charge-offs dropped to 0.61%. The rate of 90-day delinquencies held steady. Credit trends have strengthened, though management’s estimated 3.7% all-in figure remains unchanged.
Is SoFi effectively expanding its business outside of lending and interest income?
Fee-based revenue totaled $472.3 million, accounting for 39% of revenue for the quarter. This represented a 22% increase from the previous quarter. Financial Services revenue rose 29% to $466.3 million. Technology Platform revenue declined 23% to $84.5 million, though it was up 13% from last quarter. Contribution margin in that segment decreased from 30% to 14%. The business is showing signs of diversification, but technology remains its least robust area.
Is member expansion alongside cross-selling driving improved business economics?
Membership climbed 35% to 15.8 million, with products up 42% to reach 24.4 million. The average number of products per member hit a new high of 1.54. Existing customers accounted for 51% of new product openings, compared with 35% the previous year. Deposits rose by $5.3 billion during the quarter to total $45.5 billion. Despite these gains, Financial Services contribution margin declined by six points to 46%. The customer flywheel continues to gain momentum, but growth-related expenses remain substantial.
Is SoFi's capital position adequate, and is there cause for investor concern regarding dilution?
SoFi reported a Common Equity Tier 1 (CET1) capital ratio of 18.7%, exceeding the required minimum of 7.0%. Tangible book value grew 56% from a year ago to $7.34 per share. The number of shares outstanding increased by about 1.6% in the first half, while diluted weighted-average shares for the quarter were 14.3% higher year-on-year. With shares at $16.47, SOFI trades at roughly 2.24 times its tangible book value. Capital remains robust, though dilution per share continues to be a factor.
What is a sensible stock price range for the next twelve months?
Based on management's adjusted EPS forecast of $0.60, SOFI trades at around 27.5 times earnings. Applying a standard earnings multiple in the 28–32 range suggests a share price of roughly $17–$19. A higher multiple of 35–40 would indicate $21–$24 per share, while a lower multiple between 22–25 points to a valuation of $13–$15. These figures represent valuation ranges rather than exact targets. Consensus analyst price targets are $19.87 and $22.67, with both analysts rating the stock a Hold. The variance stems from differences in analyst methodologies, assumptions and timing of updates.
Michał Rogucki is a senior markets reporter at TS2.tech. His coverage ranges from stocks and technology to economic developments affecting global markets. He graduated from Humboldt University of Berlin and worked in investment research and market analysis before becoming a financial journalist.