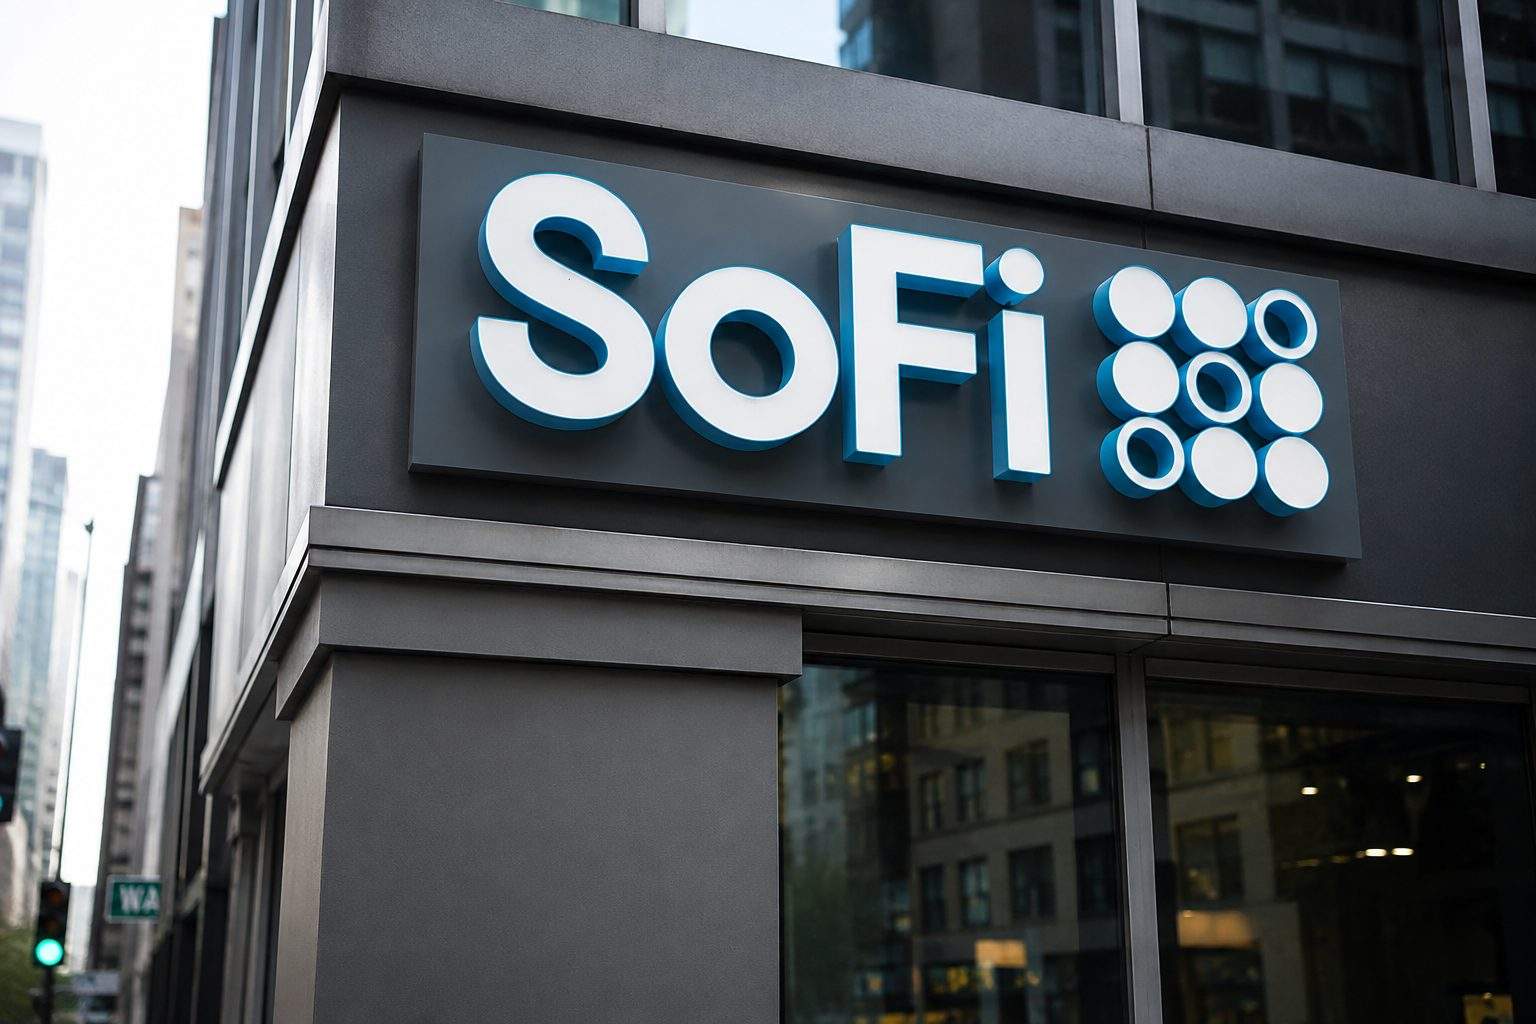

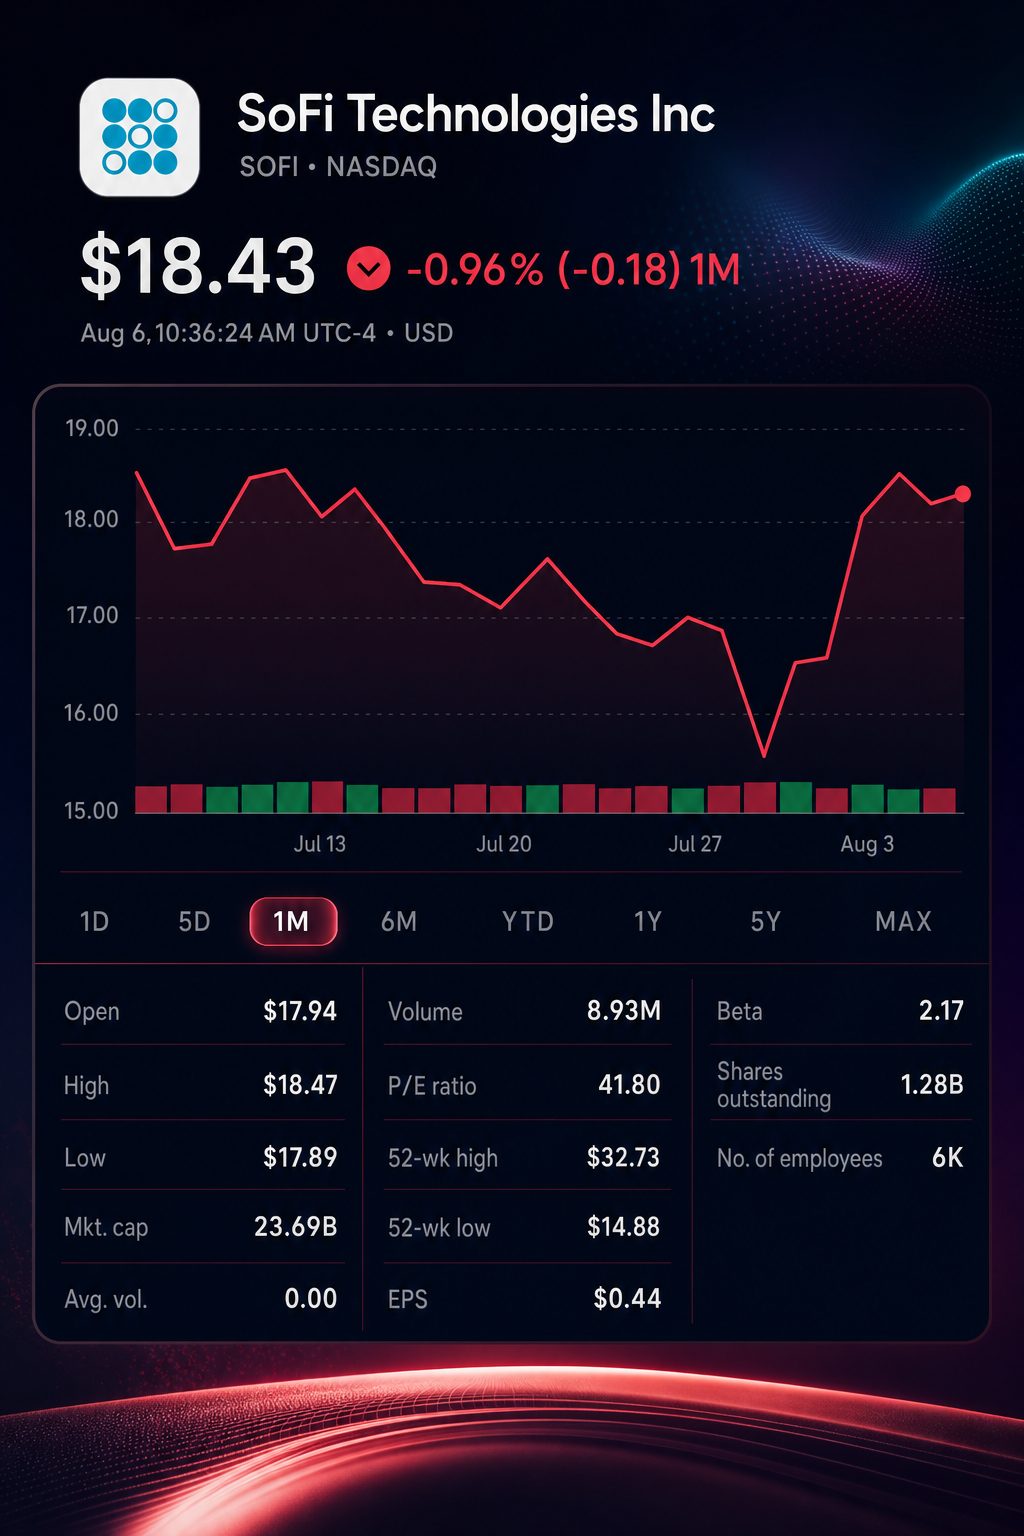
NEW YORK, August 6, 2026, 10:17 EDT. SoFi Technologies NASDAQ:SOFI stock was largely unchanged after the company’s introduction of new funds, as investors evaluated the impact on fees.
- U.S. markets were trading. SoFi shares last changed hands at $18.26 at 10:02 EDT, edging higher by less than 0.1%.
- Minimum investments for three recently launched private-market funds are set at either $500 or $2,500.
- SoFi’s company-calculated CET1 ratio decreased by 240 basis points compared to the previous quarter.
Shares of SoFi Technologies, Inc. NASDAQ:SOFI traded flat early Thursday. The fintech firm recently introduced three new private-market funds, aiming to gauge if cross-selling can boost fee revenue while preserving bank capital.
The statement gave no figures for anticipated assets or earnings contribution, leaving the short-term financial effect unclear. The deal’s rationale centers on SoFi’s base of 15.8 million members and growing cross-buy rates.
The situation is offset by balance-sheet factors. Loans accounted for at fair value climbed 14.6% from the prior quarter. Risk-weighted assets advanced 16.5%, while CET1 capital rose 3.2%. The firm’s estimated CET1 ratio dropped to 18.7% from 21.1%.
Comparison of share prices and valuations
| Measure | Reference | Result |
|---|---|---|
| Most recent trade | $18.26 | up 0.1% from August 5 |
| Change since post-results close | $15.25 on July 29 | gain of 19.7% |
| Difference to 52-week high | $32.73 | down 44.2% |
| Price / 2026 adjusted earnings per share forecast | $0.60 | 30.4x |
| Price / Q2 tangible book value | $7.34 | 2.49x |
Calculations at the current price are based on $18.26. The EPS forecast is a non-GAAP metric reported by the company.
The AngelList USVC fund has a minimum investment of $500. CAZ offers two funds, each with a starting point of $2,500. Repurchases are planned to occur at set intervals and will be capped. SoFi CEO Anthony Noto stated the company is “making alternative investing more accessible.” SoFi Investors
Member data back up the strategy. Current users accounted for 51% of new product openings, rising from 35% the previous year. The average products per member climbed to 1.54. Brokerage revenue was nearly 2.5 times higher than a year ago. Fee-based revenue totaled $472.3 million, making up 39% of overall revenue.
Second quarter operational comparison
| Metric | Q2 2026 | Q2 2025 | Change |
|---|---|---|---|
| Adjusted net revenue | $1,205.6 million | $858.2 million | +40% |
| Adjusted EBITDA | $357.8 million | $249.1 million | +44% |
| GAAP diluted EPS | $0.12 | $0.08 | +50% |
| Members | 15.814 million | 11.746 million | +35% |
| Products | 24.381 million | 17.142 million | +42% |
| Fee-based revenue | $472.3 million | $377.5 million | +25.1% |
| Technology Platform revenue | $84.5 million | $109.8 million | -23% |
Non-GAAP metrics include adjusted revenue and EBITDA.
Loan origination was still the main driver. In Q2, volumes hit $14.8 billion, increasing by 69%. Personal loans made up $10.7 billion of that amount. The Loan Platform Business represented $3.1 billion, amounting to 28.9% of personal loan originations.
Reported metrics showed credit conditions getting better. The annualized charge-off ratio for personal loans declined to 2.62% compared to 3.03%. SoFi projected an overall rate close to 3.7% when excluding sales of late-stage delinquent loans.
Capital utilisation compared with capital appreciation
| Metric | Q1 2026 | Q2 2026 | Sequential change |
|---|---|---|---|
| Loans at fair value | $40.67 billion | $46.60 billion | up 14.6% |
| Risk-weighted assets | $41.79 billion | $48.68 billion | up 16.5% |
| CET1 capital | $8.83 billion | $9.11 billion | up 3.2% |
| CET1 ratio | 21.1% | 18.7% | down 240 basis points |
| Buffer over 7% minimum | 14.1 percentage points | 11.7 percentage points | down 240 basis points |
SoFi stated that the regulatory capital figures and ratios are based on estimates by the company.
Noto stood by the decision to grow the balance sheet, stating it gives “very strong visibility into our revenue for 2027.” Chief Financial Officer Chris Lapointe noted that maintaining a risk-based capital ratio in the low-to-mid-teens range is suitable for the longer term. Q4 Capital
The management increased its forecast for adjusted net revenue to a range of $4.75 billion to $4.85 billion. Guidance for adjusted EBITDA remains close to $1.6 billion, while adjusted EPS stays at approximately $0.60. Shares are trading at $18.26, reflecting a 30.4 multiple on that adjusted EPS outlook.
After results, four major analyst firms now set price targets between $15 and $24. The spread reflects differing Wall Street views on fee expansion and capital requirements.
Analyst calls after Q2
| Firm and analyst | Recommendation | New target | Previous | Implied move from $18.26 |
|---|---|---|---|---|
| Mizuho Securities, a subsidiary of Mizuho Financial Group NYSE:MFG — Dan Dolev | Outperform | $22 | $29 | +20.5% |
| Needham & Co. — Kyle Peterson | Buy | $24 | $25 | +31.4% |
| Morgan Stanley NYSE:MS — Jeffrey Adelson | Underweight | $15 | $16 | -17.9% |
| BofA Securities, Bank of America Corp. NYSE:BAC — Mihir Bhatia | Underperform | $16 | $17 | -12.4% |
Implied moves are calculated based on the current $18.26 share price.
Public.com’s consensus from 14 analysts stayed at Hold on Thursday. The price target of $21.93 suggests potential gains of roughly 20% from the prior close. Aggregated analyst information can vary based on provider sources and update timing.
The Technology Platform segment continued to underperform, with revenue down 23% from a year earlier at $84.5 million. This came despite a 13% increase from the previous quarter. The loss of a major client continued to impact performance.
Risks: Weak consumer demand may lead to higher defaults and impact fair-value outcomes. Accelerated lending growth might narrow capital buffers. Fresh funds introduce both liquidity and valuation uncertainties, and their impact on earnings has not been revealed.
The subsequent indicator is the composition of revenue. In the second quarter, fee-based revenue accounted for 39% of total revenue. Investors are watching for this proportion to climb as capital ratios level off. If not, SoFi’s expansion will continue to rely more on capital.
Related articles: NASDAQ:SOFI





![Asia Stock Market Today 27/08/2026 [UPDATE: 00:10 SGT] [Chip Losses Narrow as KASE Global Enters Final Hour]](https://ts2.tech/wp-content/uploads/2026/08/Asia-market-dashboard-2026-08-27-0010-480x384.jpg "Asia Stock Market Today 27/08/2026 [UPDATE: 00:10 SGT] [Chip Losses Narrow as KASE Global Enters Final Hour]")