
NEW YORK, August 6, 2026, 12:05 EDT — Trading begins on U.S. markets
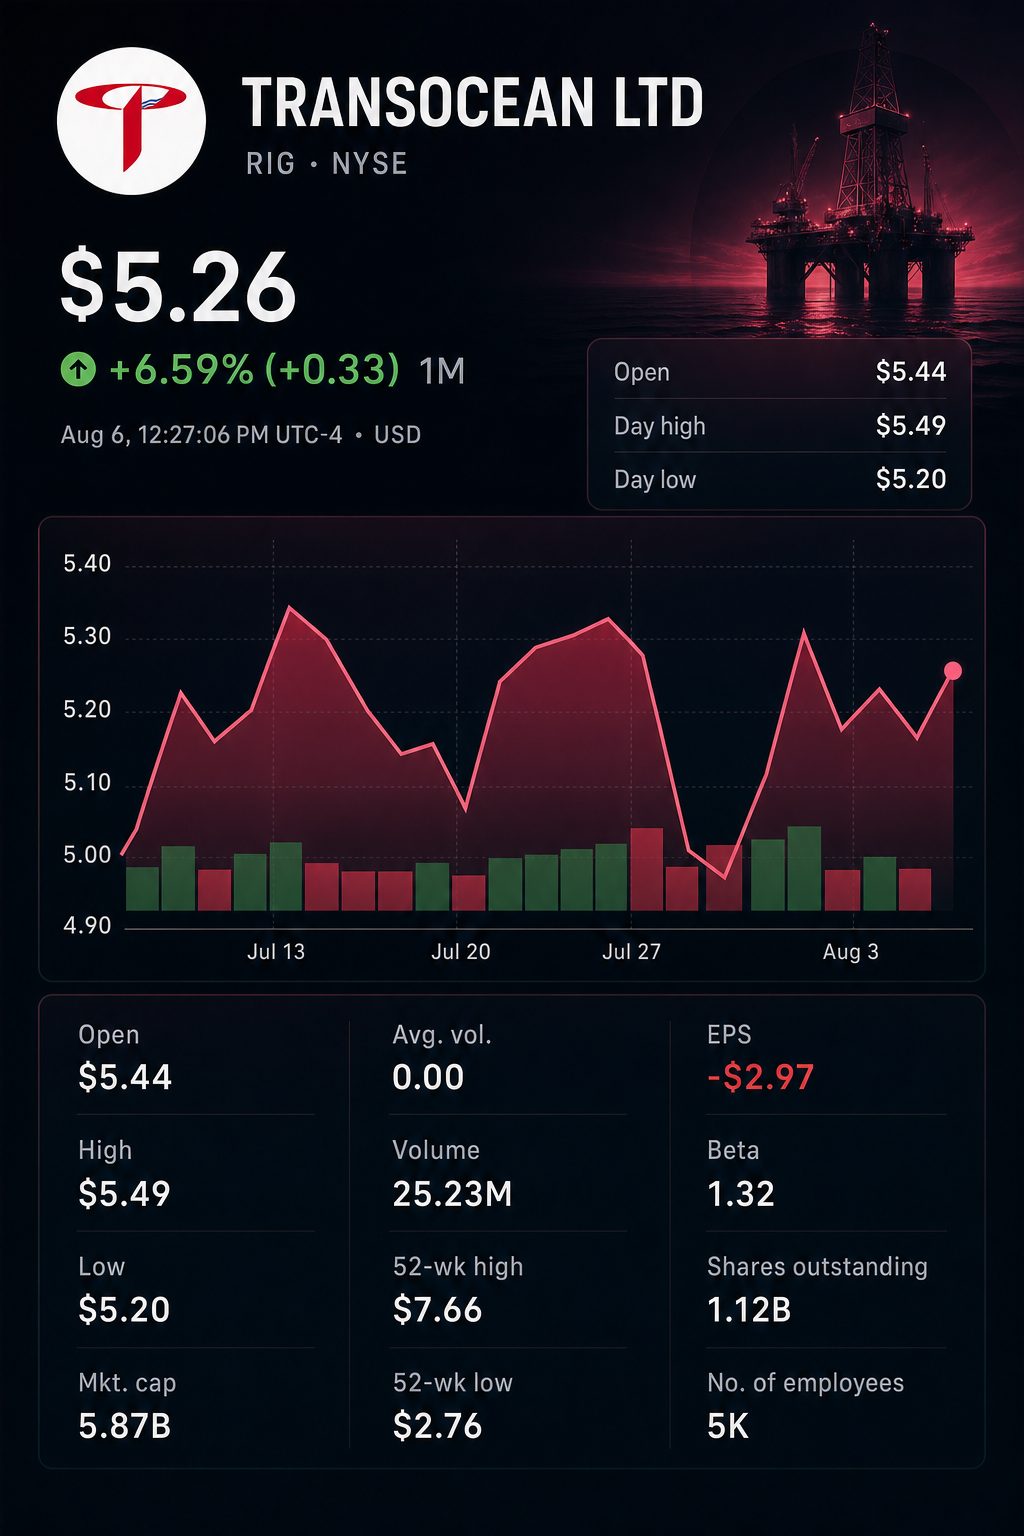
- At 11:50 a.m. EDT, shares rose 2.3% to $5.26.
- Free cash flow for the second quarter totaled $212 million, representing 68% of adjusted EBITDA.
- Initial estimates suggest second-half capital expenditures will total approximately $98 million.
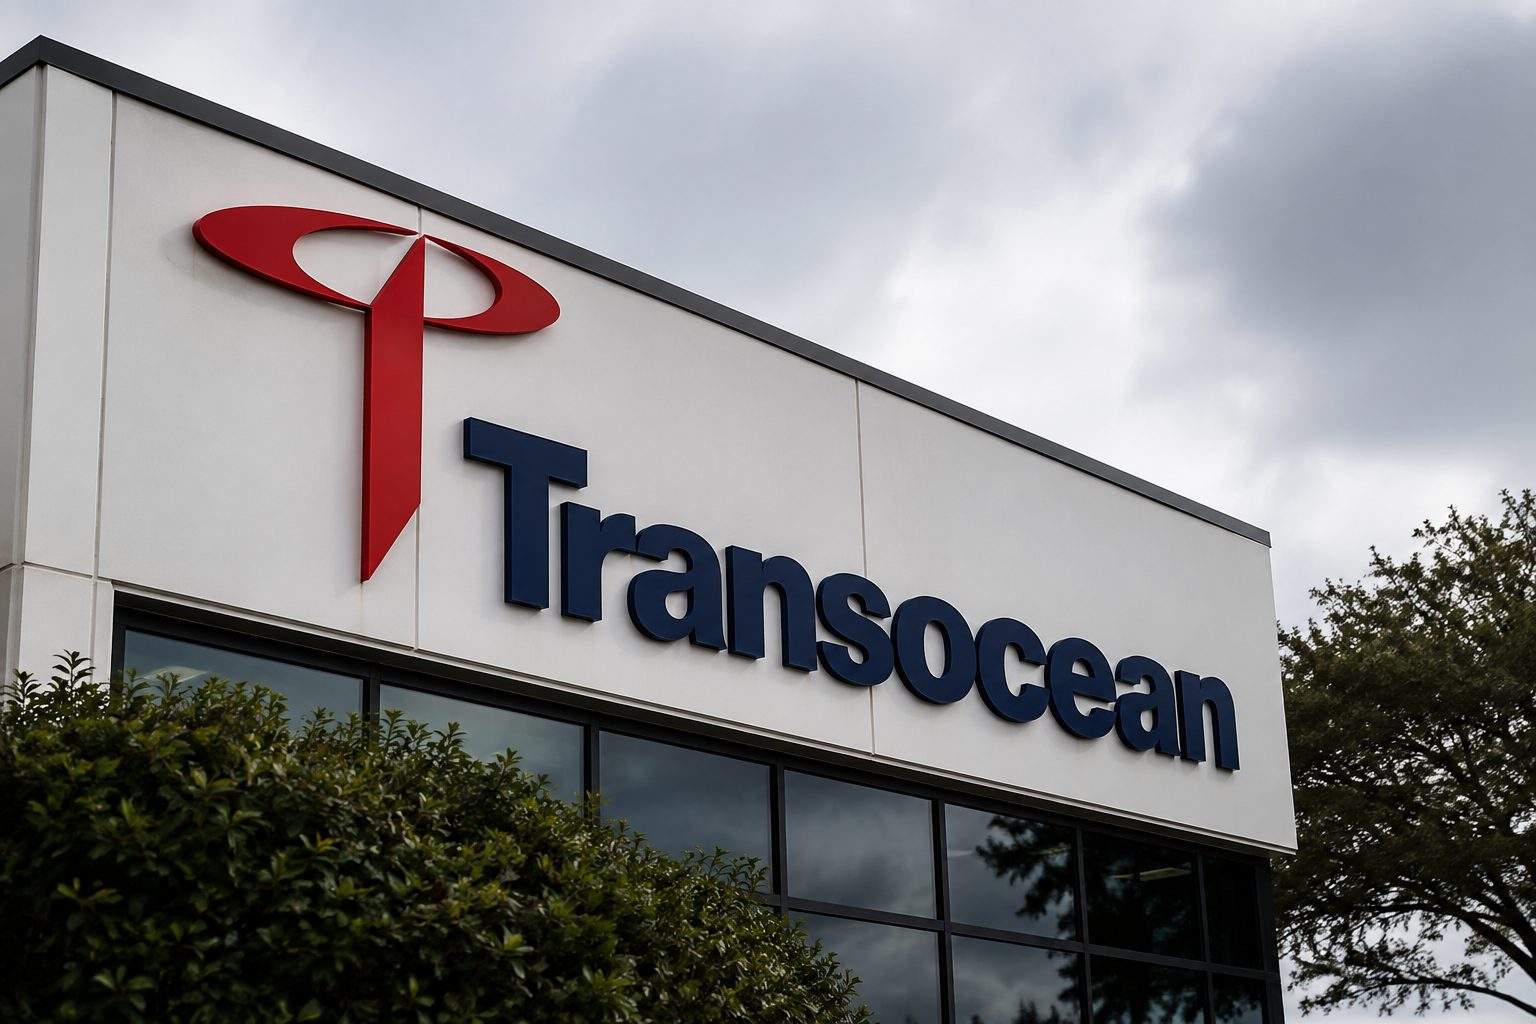
Transocean’s financial performance in the second quarter highlighted strong cash conversion, overshadowing the slight earnings beat and forming the basis for Thursday’s investment argument. Despite lower revenue and EBITDA compared to the prior quarter, free cash flow hit $212 million, marking the key result.
Free cash flow represented 68% of adjusted EBITDA. In both reference periods, the ratio stood close to 31%. This is significant for a driller with $5.11 billion in debt principal.
Adjusted earnings reached three cents per share, surpassing the expected one cent. Revenue exceeded consensus by 0.35%. The quarter did not show widespread improvement in operations.
| Quarterly scorecard | Q2 2026 | Q1 2026 | Q2 2025 | Sequential change |
|---|---|---|---|---|
| Contract drilling revenue | $966m | $1.081bn | $988m | -10.6% |
| Revenue efficiency | 97.0% | 97.3% | 96.6% | -0.3 points |
| Adjusted EBITDA | $312m | $440m | $344m | -29.1% |
| Adjusted EBITDA margin | 32.2% | 40.7% | 34.9% | -8.5 points |
| Free cash flow | $212m | $136m | $104m | +55.9% |
Figures are reported by the company; percentage changes are calculated.
Revenue dropped due to lower utilization, in line with management’s forecasts. Operating costs held steady, putting pressure on margins. However, operating cash flow increased by $72 million compared to the previous quarter.
Chief Executive Keelan Adamson described the outcome as “excellent cash flow and improved liquidity.” Net debt dropped by $210 million in the quarter. The total was $4.31 billion, or 2.8 times trailing adjusted EBITDA. SEC
| Cash and leverage measure | Q2 2026 | Q1 2026 | Q2 2025 |
|---|---|---|---|
| Free cash flow | $212m | $136m | $104m |
| Free cash flow/adjusted EBITDA | 68.0% | 30.9% | 30.2% |
| Net debt | $4.312bn | $4.522bn | $5.882bn |
| Net debt/trailing EBITDA | 2.8x | 2.9x | 4.7x |
| Debt principal | $5.107bn | $5.137bn | $6.654bn |
Transocean’s reported non-GAAP numbers form the basis for the conversion ratios. Over the last 12 months, net debt decreased by 27%.
Excluding the impact of bond-accounting, underlying interest expense totaled $114 million, representing 37% of adjusted EBITDA. As a result, cash flow continues to outweigh reported net income in importance.
The conversion rate for the quarter may not recur. Revenue guidance for the third quarter stands between $920 million and $960 million, with the midpoint representing a 2.7% drop compared to the second quarter.
Capital expenditure is projected to climb as well. An initial estimate places capex for the second half at approximately $98 million, compared with $52 million in the first half. This marks an 89% rise.
| Near-term outlook | Q2 2026 actual | Q3 2026 guidance | Change at midpoint |
|---|---|---|---|
| Contract drilling revenue | $966m | $920m-$960m | -2.7% |
| Revenue efficiency | 97.0% | 96.5% | -0.5 points |
| Operating and maintenance costs | $608m | $595m-$625m | +0.3% |
| Capital spending | $24m | $40m-$50m | +87.5% |
Guidance for full-year capital expenditures is unchanged at $150 million. The estimate for the second half is calculated by subtracting first-half spending from the annual target.
The backlog offers a degree of support. Transocean disclosed $6.7 billion in backlog, equivalent to roughly 1.7 times its projected midpoint for annual revenue. An additional $1 billion associated with Equinor NYSE:EQNR is still subject to partner clearance. Factoring that in would bring coverage close to double.
Pricing is more varied than the headline backlog implies. Contractual dayrates for ultra-deepwater rigs decline modestly through mid-2027, while harsh-environment rates stay elevated and reach their peak earlier, in the coming year.
| Estimated average contractual dayrate | Q3 2026 | Q4 2026 | Q1 2027 | Q2 2027 |
|---|---|---|---|---|
| Ultra-deepwater rigs | $451,000 | $451,000 | $449,000 | $447,000 |
| Harsh-environment rigs | $462,000 | $459,000 | $476,000 | $468,000 |
The figures shown are the highest contractual values prior to accounting for downtime and other adjustments.
Management anticipates industry-wide utilization rates for premium rigs to exceed 90% in 2027. Present contract figures indicate that harsh-environment rig capacity is experiencing firmer pricing trends. This is an observation, not an official outlook from the company.
Shares of Transocean climbed 2.3% to $5.26. Valaris NYSE:VAL advanced 2.3% as well, and Noble NYSE:NE was up 3.5%. As a result, Transocean matched the move by Valaris but trailed Noble.
The planned all-stock deal with Valaris prioritises debt reduction. The agreement reached in February outlines a merged fleet totalling 73 rigs. Executives have set a goal of reducing leverage to roughly 1.5 times within two years of completion.
Analyst opinions differ. According to Google Finance, out of five recent recommendations, there are three Buys, one Hold, and one Sell. The consensus price target stands at $7.20, representing a roughly 37% premium to Thursday’s closing price. All ratings were issued before the most recent earnings.
| Analyst recommendations | Analyst | Rating | Target | Date |
|---|---|---|---|---|
| Morgan Stanley NYSE:MS | Joe Laetsch | Hold | $7.00 | July 16 |
| Barclays LON:BARC | Eddie Kim | Buy | $8.00 | July 15 |
| Bank of America NYSE:BAC | Saurabh Pant | Sell | $4.00 | July 15 |
| Susquehanna | Charles Minervino | Buy | $7.00 | July 8 |
| BTIG | Gregory Lewis | Buy | $10.00 | May 12 |
Price targets span from $4 to $10, a range that highlights divergent views on utilization, debt reduction, and merger progress.
Risks: Increased capital expenditure in the second half could impact free cash flow conversion. Delays in contracts, operational downtime or softer spending by producers might decrease the backlog value. The Valaris deal presents both regulatory hurdles and integration challenges.
The upcoming test is straightforward. Transocean needs to maintain liquidity amid declining revenue and increasing capital expenditures. The second quarter demonstrated that the cash engine is operational. The third quarter will reveal if it can be sustained.
Related articles: NYSE:RIG