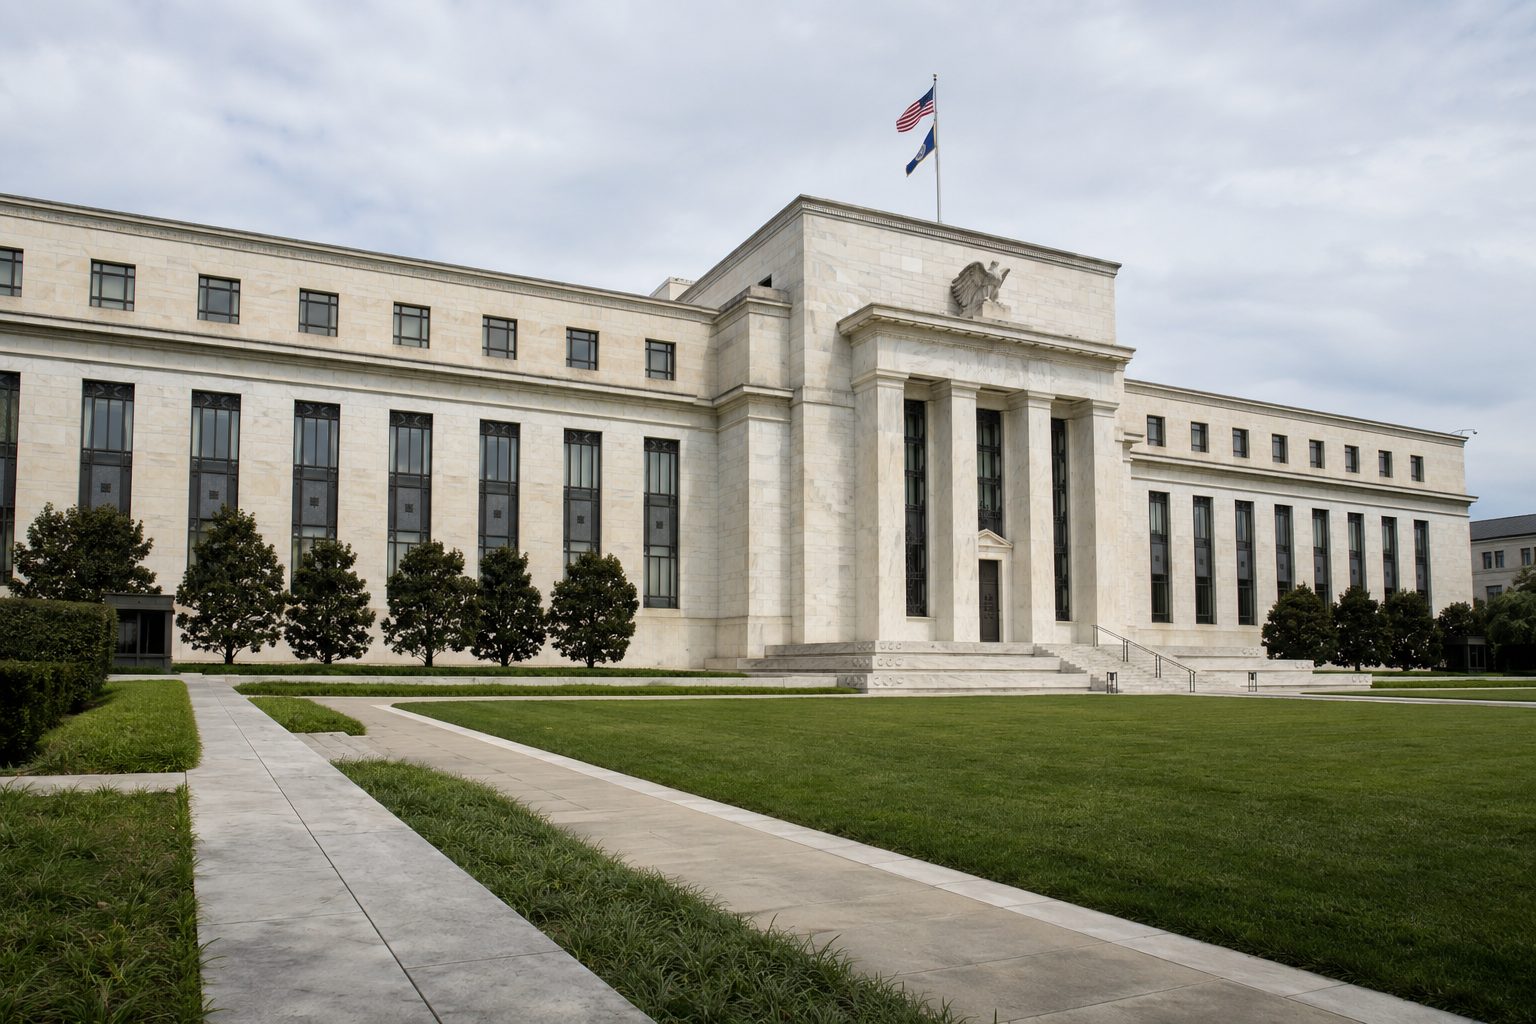

New York, August 28, 2026, 12:48 (EDT) — Investors pulled $22.33 billion from U.S. equity funds as significant withdrawals from large-cap funds surpassed smaller gains seen in small-cap allocations.
- U.S. equity funds saw outflows of $22.33 billion, marking the largest withdrawal in five months.
- Large-cap funds saw outflows of $24.73 billion, whereas mid- and small-cap funds recorded inflows totaling $3.03 billion.
- Bond funds recorded inflows of $7.12 billion, marking the nineteenth straight week of gains.
U.S. equity funds posted their largest outflows since March, although the pullback was mainly concentrated in large-cap holdings.
Investors withdrew a net $22.33 billion in the week ending August 26, according to LSEG Lipper data reported by Reuters. Outflows from large-cap funds totaled $24.73 billion.
Mid-cap funds saw inflows totaling $2.24 billion, while small-cap products brought in an additional $794 million. In combination, these gains offset just 12.3% of large-cap outflows.
The change in allocation appears defensive rather than indiscriminate. Investors trimmed exposure to index-heavy positions while maintaining targeted equity risk.
| Fund category | Weekly net flow | Investor signal |
|---|---|---|
| U.S. equity funds | −$22.33 billion | Biggest withdrawal since March 18 |
| Large-cap equity | −$24.73 billion | Core positions scaled back |
| Mid-cap equity | +$2.24 billion | Risk appetite held for select names |
| Small-cap equity | +$794 million | Risk preference maintained for select stocks |
| Technology sector | +$1.81 billion | AI names continued to draw inflows |
| Financial sector | −$1.42 billion | Worries about rates persisted |
| U.S. bond funds | +$7.12 billion | Inflows streak reached nineteen weeks |
| Money-market funds | −$8.58 billion | Outflows posted for second week running |
Bond appetite provided the most distinct offset. Inflows of $7.12 billion accounted for around 32% of net equity outflows.
Short- and intermediate-term government and Treasury funds saw inflows of $3.3 billion, accounting for 46% of total bond-fund inflows and marking the category’s best week since July 8.
Market action on Friday diverged from the week’s distribution. By 12:28 p.m. EDT, iShares Russell 2000 ETF (NYSEARCA: IWM) was down 1.29% at $295.94.
SPDR S&P 500 ETF Trust (NYSEARCA: SPY) slipped 0.17%, while Invesco QQQ Trust (NASDAQ: QQQ) was down 0.64%.
The divergence provides insight. Weekly fund flows indicate positioning rather than predict results for a single session. Buying in small-caps may occur alongside brief periods of underperformance.
Monetary policy from the Fed restricted risk appetite on the day. Chair Kevin Warsh reported PCE inflation was at 3.7%, and the six-month inflation rate stood at 4.1%.
Warsh described the 2% target as non-negotiable and permanent. He stated the Fed still faced “work to do” if inflation did not demonstrably approach that level Federal Reserve remarks.
The approach sheds light on ongoing wariness toward bonds. iShares Core U.S. Aggregate Bond ETF (NYSEARCA: AGG) slipped 0.33% to $97.51 on Friday, even as it saw a weekly inflow.
Risks: Robust earnings may swiftly halt large-cap redemptions. Ongoing inflation could pose a challenge for both stocks and bonds, reducing the diversification reflected in recent weekly flows.
The key indicator is concentration. Investors did not pull entirely out of equities. They withdrew $24.73 billion from the largest firms in the market, reallocating just a small portion to other areas.
Related articles: NASDAQ:QQQ






![Asia Stock Market Today 29/08/2026 [UPDATE: 00:55 SGT] [PayPal and Nvidia Sink as KASE Global Nears Weekend Close]](https://ts2.tech/wp-content/uploads/2026/08/Asia-market-dashboard-2026-08-29-0053-480x384.jpg "Asia Stock Market Today 29/08/2026 [UPDATE: 00:55 SGT] [PayPal and Nvidia Sink as KASE Global Nears Weekend Close]")