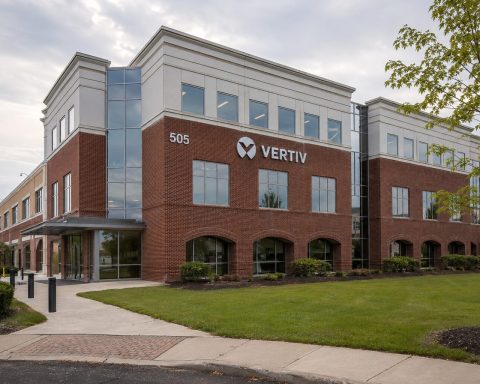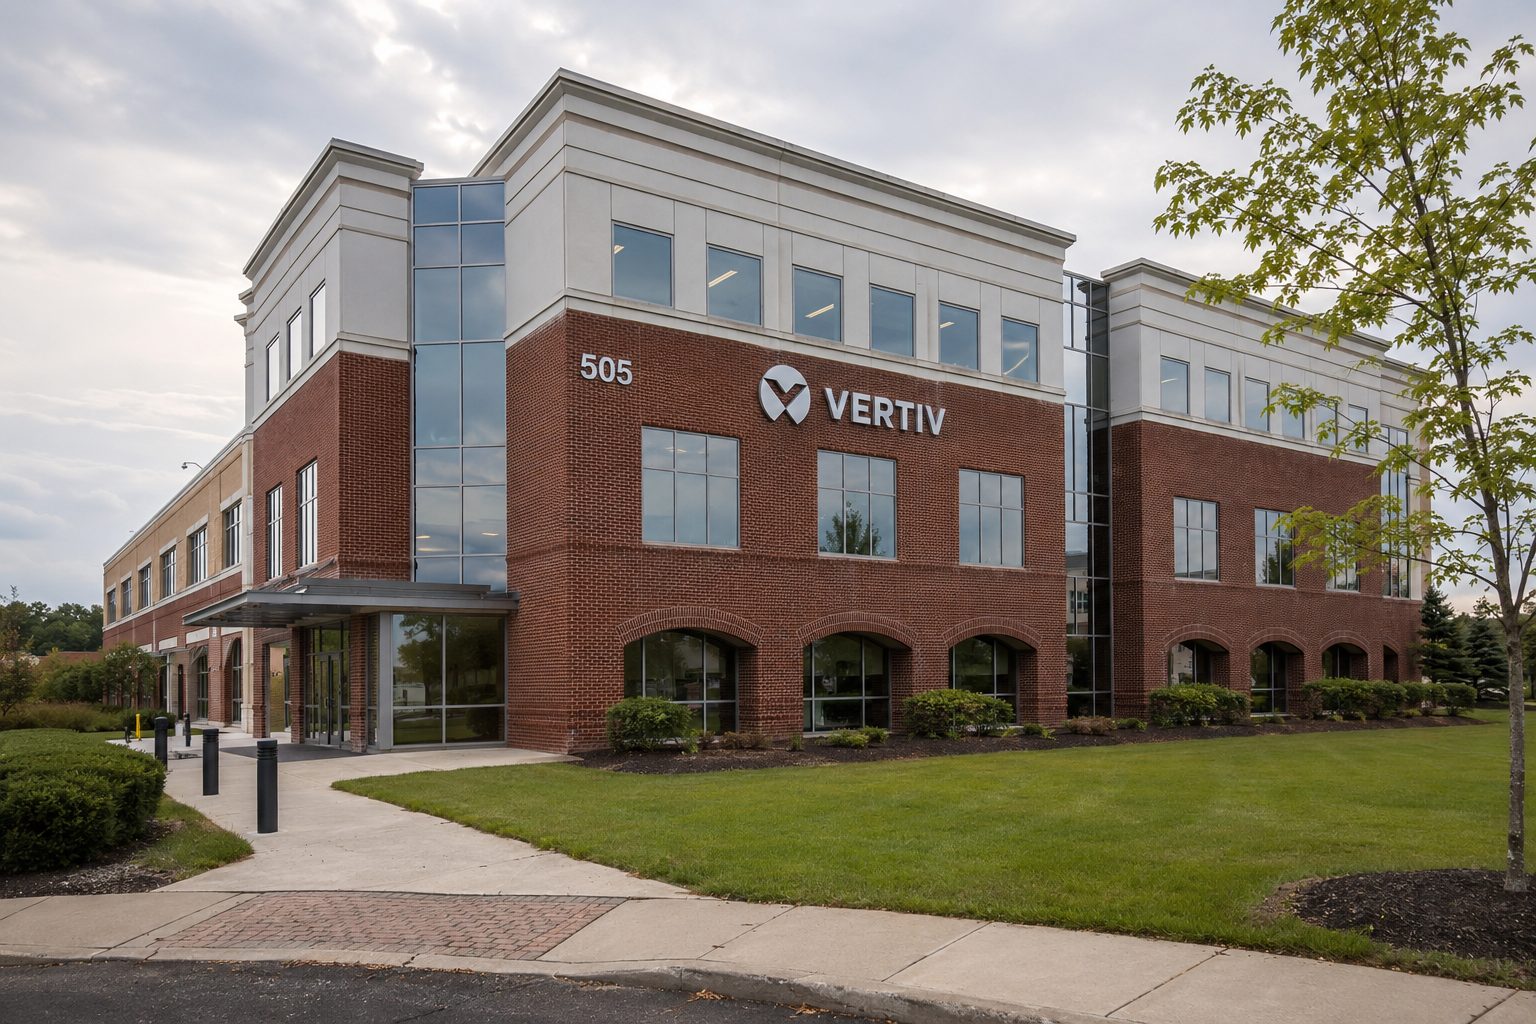

WESTERVILLE, Ohio, August 22, 2026, 6:13 p.m. EDT – Vertiv (VRT.N) saw its market capitalization drop by $12.3 billion in a week marked by a surge in bond yields, as investors reassessed fast-rising AI stock valuations.
- Vertiv dropped 10.9% over the past week, wiping out an initial $12.3 billion in market capitalization.
- The stock lagged behind the Nasdaq Composite by 8.8 percentage points.
- Following the decline, Vertiv is trading at 33.5 times its projected earnings.
- The average Wall Street price target of $338.15 is 29.1% higher than the closing price on Friday.
Vertiv Holdings Co NYSE:VRT saw its market value drop by approximately $12.3 billion last week. Shares fell 10.9%, a decrease more than five times greater than the drop in the Nasdaq Composite.
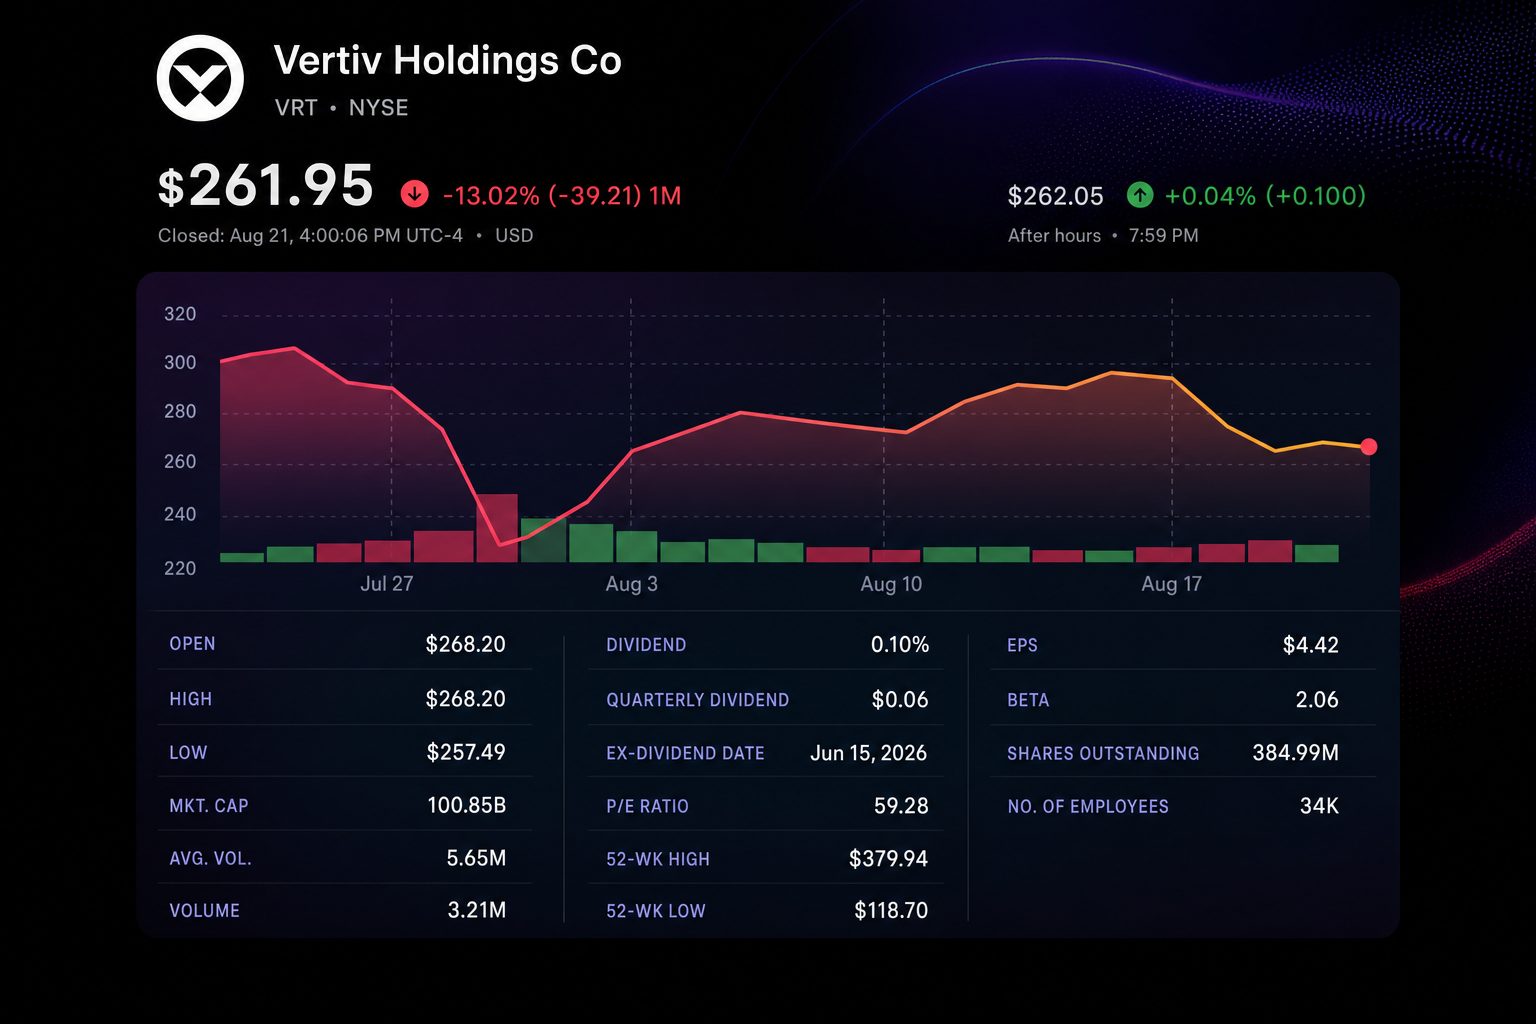
The gap puts greater scrutiny on Vertiv’s AI premium. Shares continue to trade at 33.5 times projected earnings. Rising long-term yields are increasing the challenge for this valuation.
U.S. equities finished the week in negative territory, weighed down by rising bond yields and higher oil prices, which dampened sentiment toward risk assets. Shares connected to artificial intelligence showed notable vulnerability. During the downturn, the yield on the 30-year Treasury climbed to its highest point since 2007.
| Session | Close | Daily move | Volume |
|---|---|---|---|
| Aug. 14 | $293.84 | up 2.36% | 3,153,600 |
| Aug. 17 | $292.43 | down 0.48% | 3,575,900 |
| Aug. 18 | $272.54 | down 6.80% | 5,584,100 |
| Aug. 19 | $261.00 | down 4.23% | 6,206,500 |
| Aug. 20 | $264.63 | up 1.39% | 5,219,700 |
| Aug. 21 | $261.95 | down 1.01% | 3,207,800 |
The preliminary loss calculation is based on 384.99 million shares in circulation, amounting to about 12% of the market’s $100.85 billion capitalization on Friday. The sharpest trading volume and lowest closing price of the week occurred Wednesday.
| Stock or index | Aug. 14 close | Aug. 21 close | Weekly move |
|---|---|---|---|
| Vertiv Holdings Co NYSE:VRT | $293.84 | $261.95 | -10.85% |
| Eaton Corporation plc NYSE:ETN | $451.51 | $419.20 | -7.16% |
| Super Micro Computer, Inc. NASDAQ:SMCI | $39.84 | $37.24 | -6.53% |
| Amphenol Corporation NYSE:APH | $167.11 | $157.01 | -6.04% |
| NVIDIA Corporation NASDAQ:NVDA | $225.16 | $214.72 | -4.64% |
| Nasdaq Composite | 26,729.16 | 26,180.46 | -2.05% |
| S&P 500 | 7,785.76 | 7,674.37 | -1.43% |
The retreat brought back worries highlighted in Vertiv’s July update. Sales for the second quarter totaled $3.27 billion, increasing 24%, but fell short of the approximately $3.38 billion projected by Wall Street. The company’s management attributed the shortfall to slight timing differences, supply chain congestion, and the challenges of executing complex projects.
Profitability improved, with the adjusted operating margin expanding by 410 basis points to reach 22.6%. Chief Executive Giordano Albertazzi stated, “Growth at this pace demands both vision and operational precision.” Vertiv’s Q2 release
| Operating measure | Q2 2026 or outlook | Comparison |
|---|---|---|
| Net sales | $3.274 billion | Up 24% from a year earlier |
| Organic sales growth | 18% | Lower than previous Q2 guidance of 20%–24% |
| Adjusted operating profit | $738 million | Up 51% year over year |
| Adjusted operating margin | 22.6% | Increase of 410 basis points |
| Adjusted free cash flow | $925 million | Jump of 234% from a year earlier |
| 2026 sales guide | $13.8–$14.2 billion | Organic growth of 30%–32% |
| 2026 adjusted EPS guide | $6.65–$6.75 | Up 58% to 61% |
The current valuation is down from its latest high but continues to be steep. Vertiv is priced at 59.3 times its trailing earnings and 33.5 times projected earnings. The stock ended Friday 10.9% under its 50-day average, though still 3.5% higher than the 200-day average.
Wall Street remains committed to the growth outlook. Among 28 analysts monitored, 24 recommend the shares as Buy or Strong Buy. However, the lowest price target sits at $236, representing a 9.9% decrease from Friday’s closing price.
| Analyst rating | Total or target | Return from $261.95 |
|---|---|---|
| Strong Buy | 21 | — |
| Buy | 3 | — |
| Hold | 4 | — |
| Sell / Strong Sell | 0 / 0 | — |
| Average price target | $338.15 | +29.1% |
| Median price target | $345.00 | +31.7% |
| Lowest target | $236.00 | -9.9% |
| Highest target | $427.00 | +63.0% |
Nvidia is set to report on August 26, providing insight into AI expenditure. The Federal Reserve’s Jackson Hole gathering next week may once more impact long-term yields.
Vertiv would move back above its 50-day average if it climbs over $293.89. Dropping below $253.17 would place it under the 200-day moving average. The shares have gained 105% in the past 52 weeks.
Risks: While demand might remain robust, postponed project timelines may defer revenue. Valuation could see additional compression if yields rise. Results could also face headwinds from supply chain constraints, tariffs, reliance on key customers, and softer spending by hyperscalers.
Related articles: NYSE:VRT


![Australia Stock Market Today 23/08/2026 [UPDATE: 08:38 AEST] [Healthcare Surge: Weekly Recap and Week Ahead]](https://ts2.tech/wp-content/uploads/2026/08/AU-market-dashboard-2026-08-23-0843-480x384.jpg "Australia Stock Market Today 23/08/2026 [UPDATE: 08:38 AEST] [Healthcare Surge: Weekly Recap and Week Ahead]")