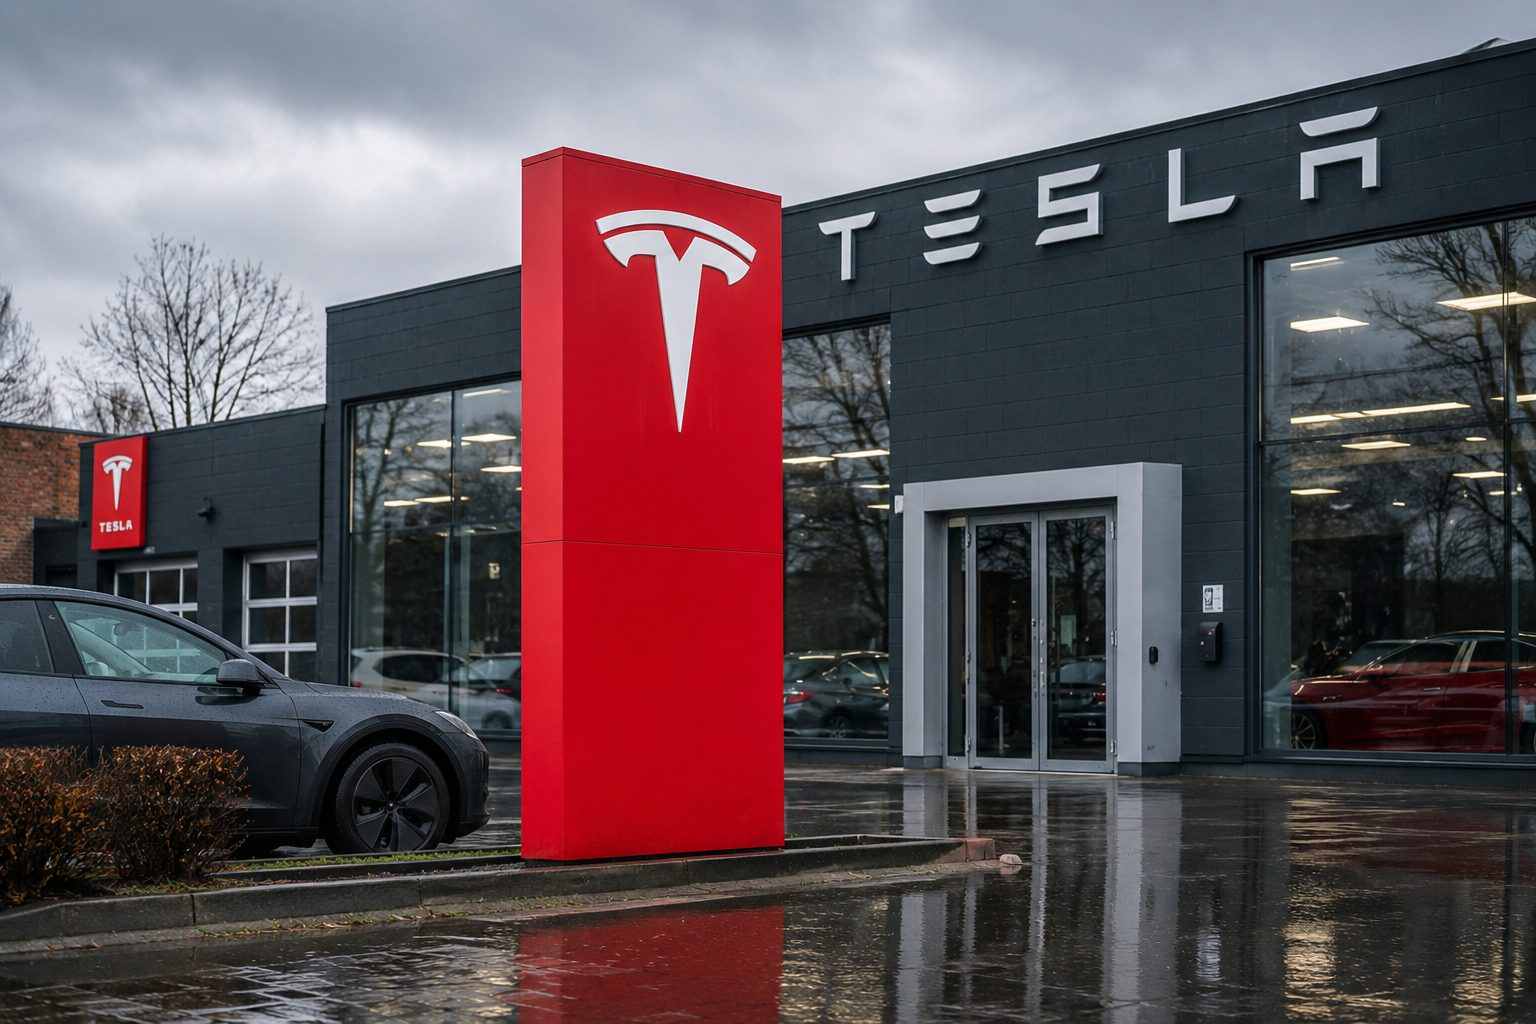
NEW YORK, July 23, 2026, 05:10 EDT – Tesla NASDAQ:TSLA stock fell as investors focused on the upcoming $16.7 billion in expenditures set for the second half of the year, raising concerns about the electric vehicle maker’s financial pressures.
- Tesla stock dropped 5.9% to $352.10 during premarket trade.
- Tesla’s second quarter revenue surpassed the consensus analyst estimate, yet adjusted EPS fell short by 40%.
- Initial calculations indicate over $16.72 billion in capital expenditure is needed for the second half.
Tesla, Inc. NASDAQ:TSLA is under increased cash-flow pressure following its weaker-than-expected quarterly profit. The company’s outlined spending strategy suggests greater financial strain may continue into the end of the year.
Capital expenditures reached $8.28 billion in the first half. Chief financial officer Vaibhav Taneja stated that total spending for the year will be above $25 billion.
This results in over $16.72 billion remaining for the July-to-December period. The early minimum amounts to $8.36 billion each quarter, representing an increase of at least 44% compared to Q2.
Tesla ended Wednesday with a closing price of $374.01, a decline of 1.3%. Shares were at $352.10 as of 5:00 a.m. ET on Thursday. U.S. cash markets had not yet opened.
The stock declined 6.6% over the week ending July 17. On Thursday morning, the price was down 7.5% from the previous Friday’s close.
Revenue increased by 26% to $28.24 billion, while deliveries rose 25%, reaching 480,126 vehicles.
Operating income dropped by 57% to $398 million. The operating margin declined to 1.4%, down from 4.1%.
The table relies on analyst averages compiled by Tesla, which the company does not officially recommend. Dollar amounts are shown in billions unless otherwise noted for per-share figures.
| Q2 metric | Actual | Compiled average | Actual versus average |
|---|---|---|---|
| Revenue | $28.24 | $27.58 | $0.65 above |
| Operating income | $0.40 | $1.50 | $1.11 below |
| Adjusted EPS | $0.33 | $0.55 | $0.22 below |
| Operating cash flow | $4.70 | $3.45 | $1.25 above |
| Capital spending | $5.79 | $6.70 | $0.91 below |
| Free cash flow | -$1.09 | -$3.25 | $2.16 improved |
Free cash flow surpassed the consensus average by $2.16 billion. However, $909 million of this resulted from capital expenditures coming in lower than projected. This advantage could be due to timing rather than actual cost reductions.
Taneja stated that expenditures are set to increase in the second half. He anticipates that capex will keep expanding over the next two to three years.
If Tesla’s Q2 operating cash flow continues in Q3 and Q4, the company could see a cash burn exceeding $7.32 billion. This initial scenario is based on annual capital expenditures totaling $25 billion.
The balance sheet allows flexibility. As of June 30, cash and short-term investments stood at $43.52 billion. The minimum burn rate represents roughly 17% of this reserve.
Core vehicle economics deteriorated. Automotive margin, excluding credits, dropped to 16.3% from 19.2% in Q1. Average vehicle revenue declined 5.8% from the prior quarter to $42,730.
Sales of regulatory credits fell by 67% to $146 million. Research expenses surged 49% to $2.37 billion. Other income came in at $590 million, surpassing operating income.
Musk described 2026 as “a massive capex year.” Direxion’s Ryan Lee noted, “Monetization remains the central concern following the earnings miss.” Reuters
Certain operating indicators showed gains. The number of active FSD subscriptions climbed 56% to 1.48 million. Storage deployments went up 41% to 13.5 gigawatt-hours.
Tesla finished trading at roughly 342 times its trailing earnings. The Federal Reserve is set to announce its decision on July 29. Advance GDP figures and June PCE numbers are due on July 30.
Risks: Projections are based on stable operating cash flow and the lowest guided capex. Higher cash flow or postponed projects may limit burn. Key factors include pricing, regulatory developments and the rollout of robotaxi operations.
Related articles: NASDAQ:TSLA