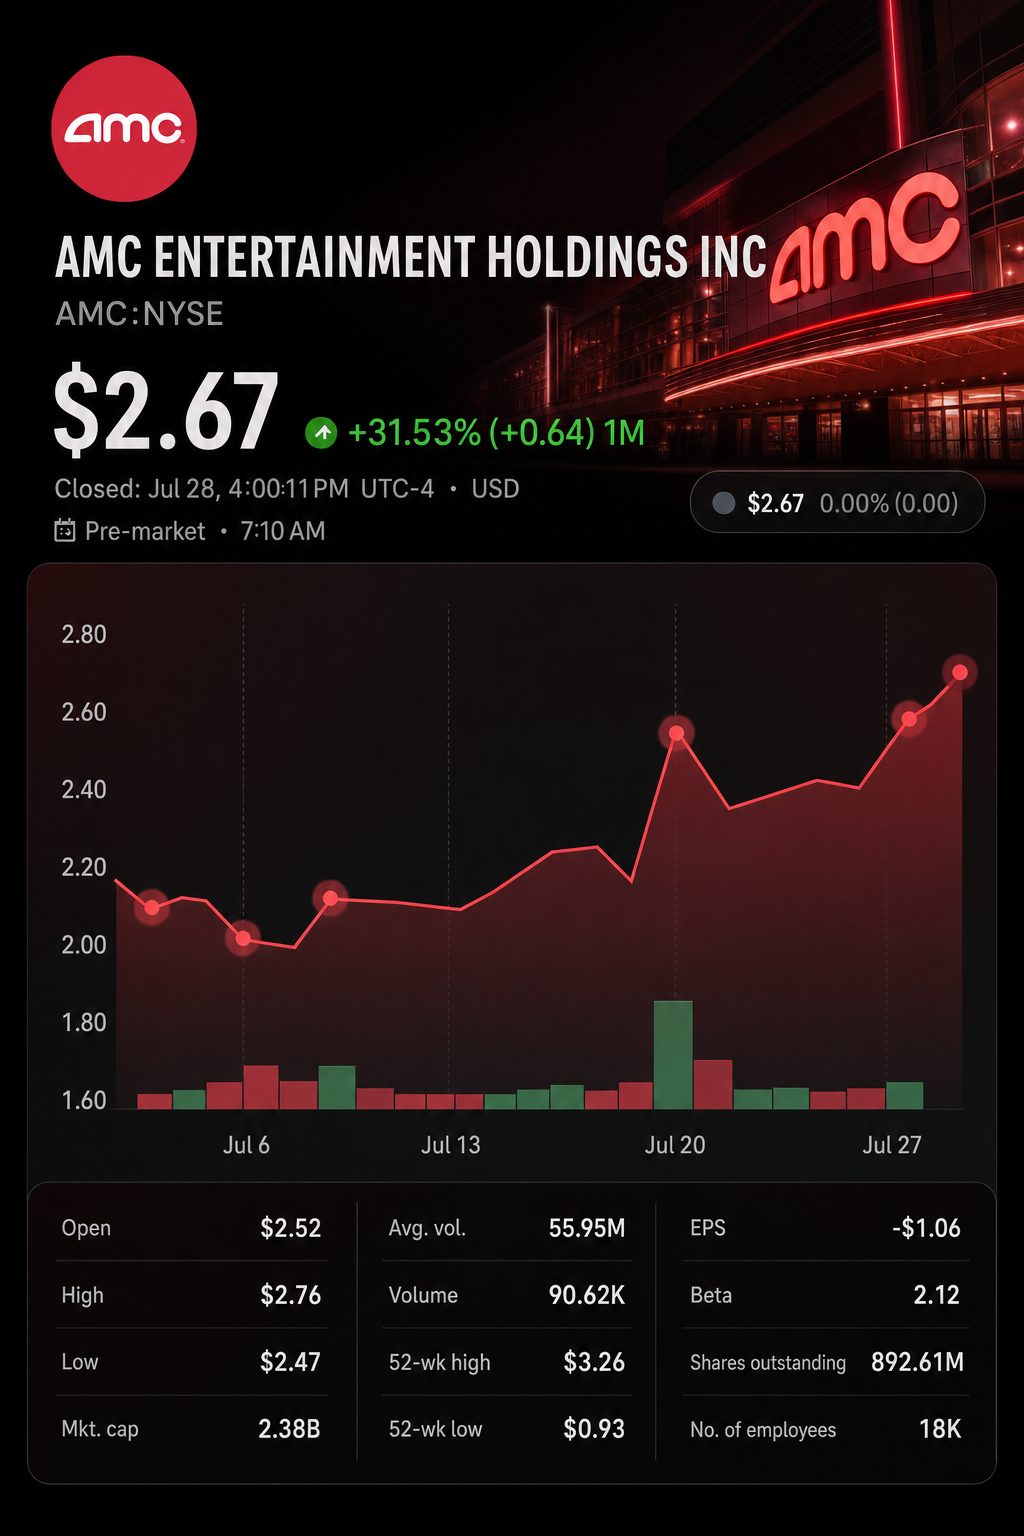
AMC trades at $2.66 following S&P upgrade, two-day surge of 18%
29 July 2026
2 mins read

AMC trades at $2.66 following S&P upgrade, two-day surge of 18%

New York, July 29, 2026, 07:01 EDT

  • AMC was last at $2.66 in premarket trade, down 0.4% from its Tuesday close.
  • S&P upgraded AMC’s credit rating to B-, though it continues to project a cash shortfall in 2026.
  • The number of shares outstanding increased by 74% over six months, as net principal debt decreased 13%.

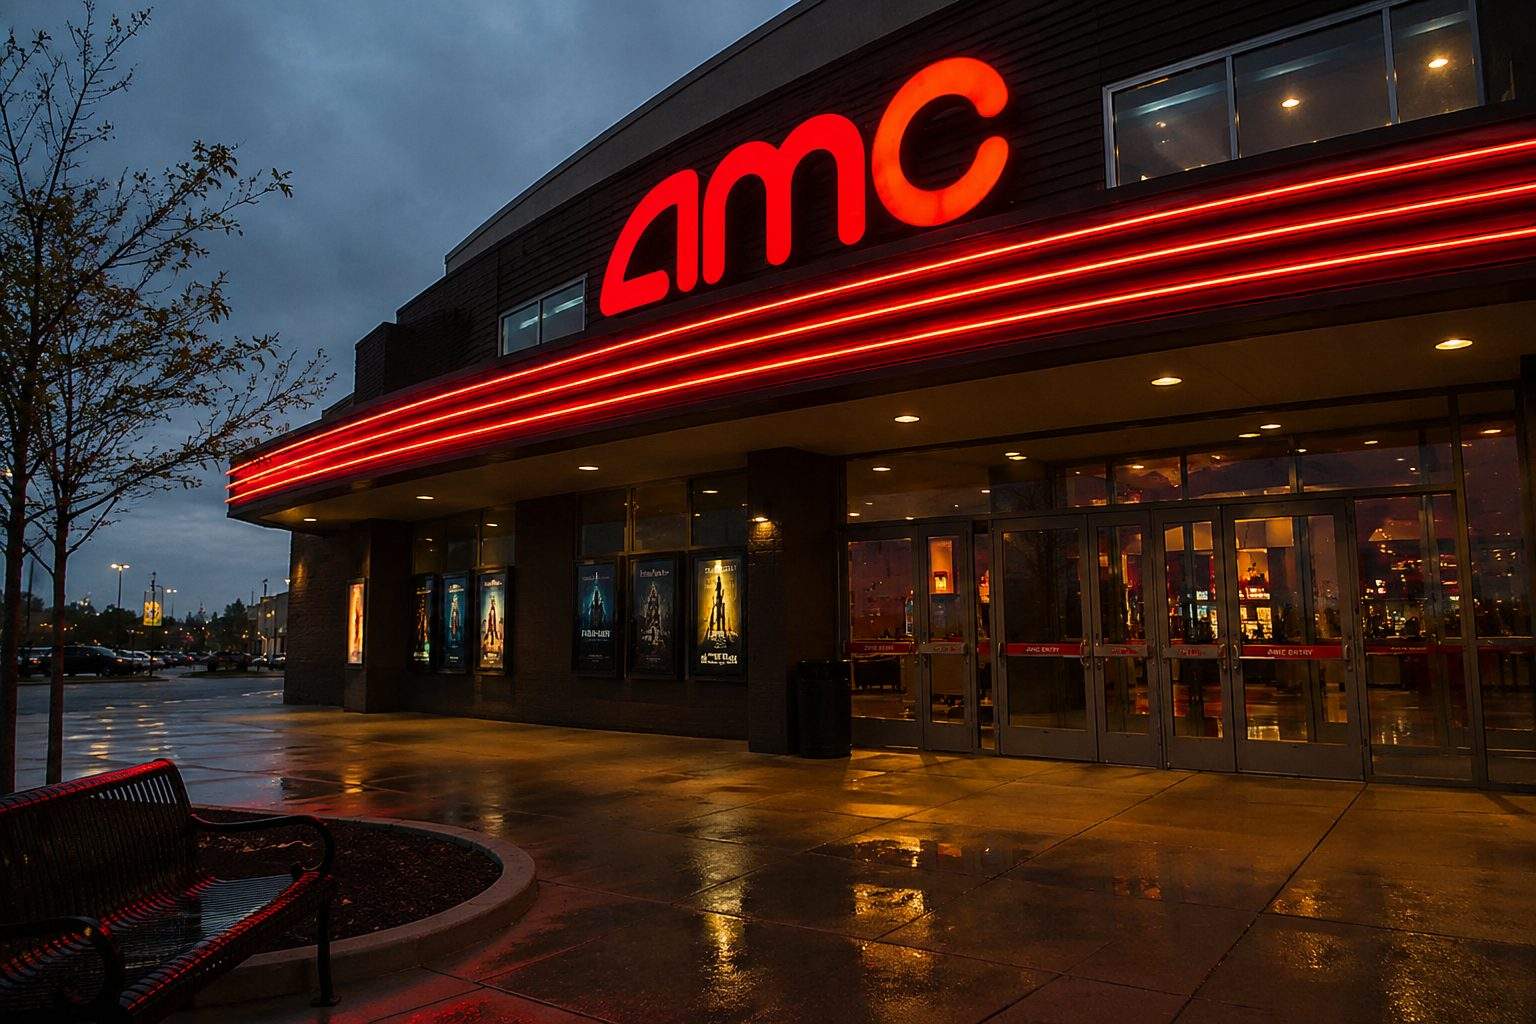
AMC Entertainment Holdings, Inc. hovered close to $2.66 ahead of Wednesday’s market open. The stock rose 17.6% over Monday and Tuesday. Trading on the NYSE core session begins at 09:30 EDT.

S&P Global Ratings, a division of S&P Global Inc. , raised AMC’s rating to B- from CCC+. The agency maintained its stable outlook, noting operational improvements and stronger credit metrics.

This represents significant credit improvement, but it does not yet indicate a full shift to equity.

AMC’s cash inflow during the second quarter largely offset the cash depletion from the first quarter. Achieving the stronger balance sheet, however, depended heavily on additional equity issuance.

AMC generated $190.1 million in free cash flow in the second quarter. Free cash flow for the first half stood at just $15.4 million. This indicates a $174.7 million outflow in the first quarter, based on company disclosures.

S&P projects that the domestic box office will near $10 billion in revenue this year. The agency, however, anticipates AMC will post a small cash shortfall in 2026. Positive free cash flow on a consistent basis is forecast beginning in 2027.

Company filings highlight the gap between operational recovery and capital dilution:

MetricLatest periodComparison periodChange
Q2 revenue$1.597 billion$1.398 billion+14.2%
Q2 adjusted EBITDA$321.4 million$189.5 million+69.6%
Adjusted EBITDA margin20.1%13.6%+6.5 points
First-half free cash flow$15.4 million-$328.1 million+$343.5 million
Shares outstanding892.6 million512.9 million+74.0%
Net principal debt$3.136 billion$3.596 billion-12.8%

Quarterly and first-half results are measured against those of 2025. Balance-sheet items compare June 30 to December 31. Net principal debt is calculated by subtracting unrestricted cash from principal borrowings.
Stock chart for NYSE:AMC

Operating leverage was evident. Adjusted EBITDA—a non-GAAP metric for profit—increased at a pace almost five times that of revenue. Chief Executive Adam Aron referred to it as “the inherent operating leverage in our business model.” SEC

Premium screens drove additional gains. The Odyssey delivered the best-ever opening two weeks for an AMC title in IMAX Corporation formats. AMC controls roughly half of the IMAX screens in the United States.

AMC posted a 13.0% rise in U.S. revenue in the second quarter, while the domestic box office saw a 10.7% increase. The company’s average screen count slipped 1.6%, indicating a more efficient utilization of its current assets.

The price was dilution. AMC’s number of shares rose to 892.6 million from 512.9 million. Net principal debt dropped roughly $460 million, aided by a $350 million rise in cash.

The restructuring delayed anticipated significant maturities to 2029. Reduced leverage brought down interest rates on a large portion of AMC’s liabilities. S&P projects that yearly cash interest payments remain above $450 million.

Tuesday’s 6.37% rise outperformed two immediate competitors. Cinemark Holdings, Inc. advanced 4.16%, while Marcus Corporation added 1.88%. AMC’s trading volume hit 61.8 million shares, surpassing its 50-day average.

The outlook for sustained cinema demand is still debated. “Strong quarters, like this one, will happen now and again. But the industry’s struggles will remain,” eMarketer analyst Ross Benes said. Reuters

The upcoming demand test takes place on Friday. Spider-Man: Brand New Day makes its debut July 31, with The Odyssey continuing its run on premium screens. Cinemark is set to announce its second-quarter earnings on Thursday.

Risks persist. AMC has roughly $850 million in yearly rent obligations, in addition to its interest expenses. The company’s filing also cautions that issuing more shares in the future could lead to further dilution for shareholders.

At present, AMC’s credit profile has strengthened more rapidly than its per-share performance. Wednesday’s session will reveal if investors are willing to bridge that discrepancy.

TS2 TECH • EXTENDED COVERAGE

Further analysis

What is the current trading level for AMC shares, and does momentum remain high?

AMC ended the July 28 session at $2.67, up 6.37%. The gain marked a second straight day of advances. Trading volume reached 61.8 million shares, compared to the 50-day average of 47.2 million. MarketWatch Premarket indication early on July 29 was at $2.68, with activity limited. Public Shares were still down 18.1% from the 52-week peak of $3.26.

By what margin did AMC surpass second-quarter forecasts?

Revenue climbed to $1.5967 billion, marking a 14.2% increase year-on-year. Analysts polled by LSEG forecast revenue near $1.47 billion, with actual results exceeding expectations by about $127 million. Adjusted diluted earnings came in at $0.14 per share, compared to a projected loss of $0.06 per share. Adjusted EBITDA jumped 69.6% to a record $321.4 million. SEC

Did AMC report profits using standard GAAP accounting?

No, not under standard GAAP reporting. AMC posted a net loss of $11.4 million, or $0.02 per share. Operating income reached $238.1 million, up from $92.6 million a year earlier. However, total other expense came to $246.1 million, offsetting operating profit. Interest on corporate debt totaled $115.9 million. Adjusted earnings factored out $63.1 million in debt losses and $51.1 million in derivative losses. AMC Entertainment Holdings, Inc.

Is AMC producing sufficient cash to reduce its financial risk?

Operating cash flow for the second quarter was $235.4 million. Free cash flow totaled $190.1 million after capital expenditures of $45.3 million. Cash and cash equivalents stood at $778.4 million at the end of June. SEC For the first half, operating cash flow was positive at $106.9 million. Management says available liquidity is expected to meet obligations over the next twelve months. AMC continues to note that stable annual cash flow depends on revenue returning to pre-pandemic levels. AMC Entertainment Holdings, Inc.

What is the remaining amount of debt following AMC’s refinancing efforts?

Principal corporate debt stood at $3.914 billion as of June 30, 2026, representing a reduction of $110 million compared with December 2025. Debt remains the main component on the balance sheet. Net principal borrowings, excluding lease liabilities, were around $3.14 billion. AMC Entertainment Holdings, Inc. According to the latest filing, a $125.5 million redemption is set for July 24. AMC indicated this will result in no significant maturities until 2029. The anticipated redemption is expected to reduce annual cash interest costs by about $7.7 million. SEC

What level of impact does dilution have on current AMC shareholders?

Shares outstanding climbed to 892.6 million as of July 22, marking a 74% increase from 512.9 million at the end of last December. In the first half, the company issued 105.3 million shares through ATM offerings and 95.25 million via direct offerings. A further 142.1 million shares were issued to settle exchangeable notes. AMC Entertainment Holdings, Inc. AMC had 168.3 million shares still authorized, unissued, and unreserved. The company can still issue more shares. Dilution risk remains present. AMC Entertainment Holdings, Inc.

Will box-office strength persist throughout the upcoming week?

The Odyssey generated around $286 million at the North American box office as of July 26. Global ticket sales totaled roughly $640 million. AMC described the film’s first two weekends as the company’s strongest IMAX performance to date. Numerous AMC IMAX 70mm showings sold out through mid-August. AMC Entertainment Holdings, Inc. Spider-Man: Brand New Day is set for a theatrical-only release on July 31. Marvel AMC’s precise revenue from these releases is not clear, as returns depend on audience turnout and distribution terms.

Is AMC experiencing gains in its theater economics, or is the uptick limited to attendance?

Quarterly attendance climbed 13.5% to 71.29 million patrons. Consolidated ticket revenue per patron eased to $12.11 from $12.14. Food-and-beverage revenue per patron edged up 1.6% to $8.08. Contribution margin per patron rose to $14.71 from $14.48. SEC Operating expenses apart from depreciation were unchanged at $458.4 million. Revenue rose 14.2%, indicating fixed-cost leverage accounted for a major part of EBITDA growth. AMC Entertainment Holdings, Inc.

Is AMC stock considered undervalued at $2.67?

At the July share count, a price of $2.67 equates to an equity value of approximately $2.38 billion. Adding principal debt from June and deducting June’s cash balance results in an estimated $5.52 billion enterprise value. This calculation does not account for leases and other possible adjustments. MarketWatch The company’s second-quarter EBITDA cannot be reliably annualized, as cinema earnings vary by season. Q2 contributed $321.4 million out of the $359.7 million total for the first half. The overall outlook depends on continued box-office momentum rather than a single strong quarter. SEC

Khadija Saeed is a financial markets reporter at TS2.tech, specializing in stocks, technology and emerging industries. She studied economics and finance at the London School of Economics and previously worked in market research before moving into financial journalism. Her coverage focuses on the companies, innovations and economic trends influencing global investors. Follow Khadija Saeed on Google News.

Google Preferred Source

TS2 TECH • AI PORTFOLIO

Top Stock Picks

Today’s highest-ranked model selections.

#1 BUY ON WEAKNESS

Visa

NYSE: V 93 / 100

Visa delivered more than just a headline beat this quarter, with spending, payment volume, cross-border volume, and processed transactions each rising by double digits.…

#2 BUY

Hubbell

NYSE: HUBB 92 / 100

Hubbell boosted its sales and profit outlook following strong double-digit organic growth. Although shares dipped 2.8% on Tuesday, the company’s operating performance is on…

#3 BUY ON PULLBACK

Xylem

NYSE: XYL 90 / 100

Xylem reported $3.1 billion in orders last quarter, providing clearer visibility than the modest 2% revenue growth indicates. Demand for water treatment is rising…

#4 ACCUMULATE

Ford

NYSE: F 86 / 100

Ford’s updated cash forecast stands out compared to its market capitalization. Strong truck pricing, product mix, and cost discipline supported this quarter. However, the…

#5 TACTICAL BUY

SoFi

NASDAQ: SOFI 82 / 100

SoFi boosted its revenue outlook following record growth in members, loan originations, and profit. Lending remains robust, but technology platform revenue dropped 23% year-over-year.…

View full portfolio
Editorial model selection. Not personalised advice.
Ondas stock climbs again as $70 million order burst raises execution bar
Previous Story

Ondas Inc. (NASDAQ:ONDS) Sees Surge in Orders; Rising Shares Increase Pressure for Delivery

KLA Corporation (NASDAQ:KLAC) drops 8.7% premarket with cash conversion trailing despite record sales
Next Story

KLA Corporation (NASDAQ:KLAC) drops 8.7% premarket with cash conversion trailing despite record sales