NEW YORK, July 30, 2026, 08:01 EDT SOXL requires a surge of 228% to return to prior levels following the semiconductor sector downturn, a much greater rebound than is needed for SOXX.
- Direxion Daily Semiconductor Bull 3X ETF NYSEARCA:SOXL ended the session 69.5% under its 52-week peak. Meanwhile, the iShares Semiconductor ETF NASDAQ:SOXX finished 29.1% beneath its highest level.
- Reaching those previous levels again would mean increases of approximately 228% and 41%, respectively. These figures are based on current prices and do not represent forecasts.
- Premarket activity in the U.S. was busy as index futures indicated gains. The main cash session had yet to begin.
The decline in chip stocks has resulted in a recovery challenge that exceeds the headline drop. SOXL finished Wednesday at $91.99, while SOXX settled at $465.
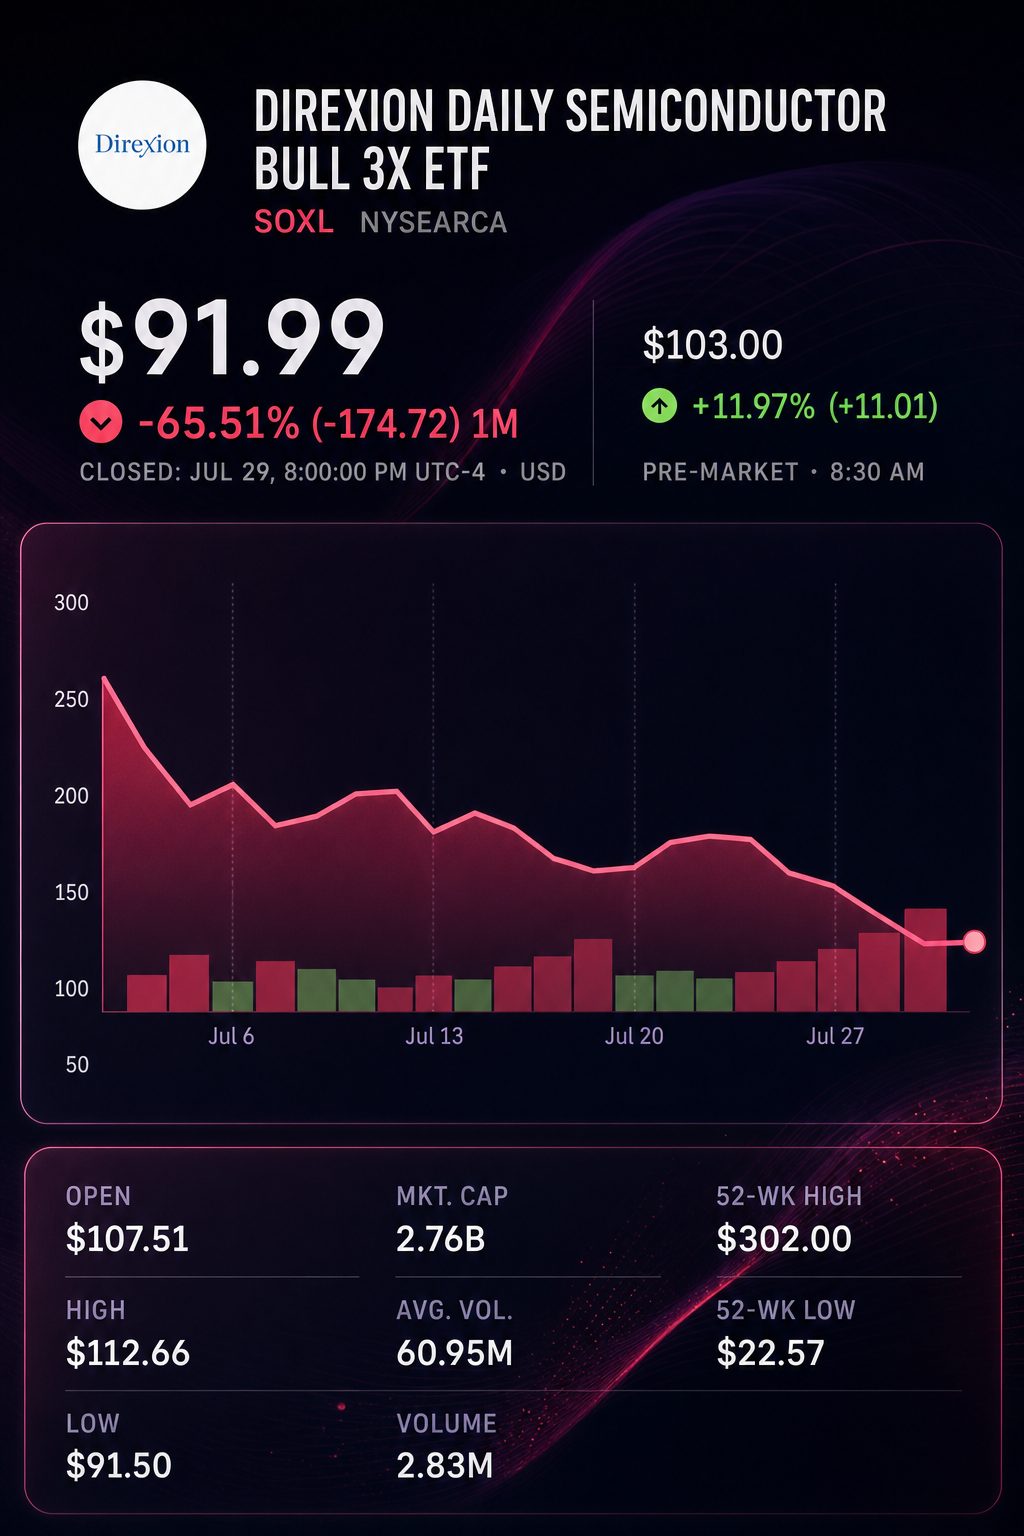
SOXL has experienced a drawdown roughly 2.4 times greater than SOXX. However, its required recovery is 5.6 times higher. This difference is a result of loss arithmetic combined with daily leverage.
Wednesday saw performance in line with the products’ intended daily tracking. SOXX dropped 5.38%. SOXL was down 16.02%. The inverse fund, SOXS, advanced 16.35%.
| Semiconductor exposure | July 29 close | One-day move | Stated exposure |
|---|---|---|---|
| SOXX | $465.00 | -5.38% | Sector index, not leveraged |
| SOXL | $91.99 | -16.02% | Tracks 300% of the benchmark’s daily move |
| Direxion Daily Semiconductor Bear 3X ETF NYSEARCA:SOXS | $73.15 | +16.35% | Seeks -300% of benchmark daily performance |
Market closing prices as of July 29.
This does not guarantee a triple return over multiple weeks. Direxion adjusts its leveraged funds on a daily basis. The sponsor advises that investors should not anticipate three-times the cumulative benchmark performance for periods longer than a single day.
The nonlinear impact occurs once losses reach significant levels. Recovering from a 29.1% drop demands a 41.1% increase. A 69.5% decrease necessitates a 228.3% rise.
| Fund | Published 52-week high | July 29 close | Drawdown | Gain needed to recover |
|---|---|---|---|---|
| SOXX | $655.94 | $465.00 | -29.1% | +41.1% |
| SOXL | $302.00 | $91.99 | -69.5% | +228.3% |
Based on the 52-week high reported by each fund. Dates of these highs can vary.
A hypothetical $100 placed at those peak levels highlights the disparity. The SOXX holding would presently be valued near $70.89, while SOXL would stand at approximately $30.46.
Yahoo Finance’s assessment relied on a previous snapshot of the same downturn, estimating SOXX had dropped close to 25% and SOXL around 63%. At that point, the necessary rebounds stood at about 33% and 170%, respectively. Losses on Wednesday increased both of those recovery targets.
Trefis provided the most optimistic precedent. The firm recorded six instances where SOXX fell by 20% or more since 2005. In four of those cases, the next 12 months saw gains. The median gain was 28%.
| SOXX drop analysis | Past outcome |
|---|---|
| Times fell 20% or more since 2005 | 6 |
| Follow-up 12-month gains recorded | 4 |
| Middle value 12-month return afterwards | +28% |
| Typical maximum further decrease | -20% |
| Performance after February 2016 slump | +73% |
| Performance after June 2022 drop | +43% |
Trefis provides these recorded historical observations. Previous results do not guarantee future outcomes.
The track record highlights why investors are drawn to purchasing on dips. It further underlines the importance of timing, as the typical investor faced an additional 20% drop within the next year.
SOXX is considered a focused investment, containing 30 securities. According to Trefis, the fund’s top five holdings make up 38% of its assets, while the ten largest comprise 61%.
| Structural feature | SOXX | SOXL | SOXS |
|---|---|---|---|
| Leverage target | None | 3x daily | -3x daily |
| Leveraged daily reset | No | Yes | Yes |
| Net expense ratio | 0.34% | 0.75% | 1.00% |
| SOXX equity holdings | 30 | Leveraged derivatives | Inverse leveraged derivatives |
Latest corporate earnings indicate that the downturn is not solely due to falling demand. SK Hynix KRX:000660 reported its highest-ever quarterly operating profit, but results fell short of high expectations, leading to a 9.6% drop in the share price on Wednesday.
BNK Investment analyst Lee Min-hee noted, “There are concerns that tech firms will take a breather in infrastructure spending.” However, management conveyed a different message. President Song Hyun-jong said, “Major customers are still requesting more memory supply.” Reuters
SK Hynix has wrapped up negotiations for roughly 10 long-term supply deals. The difference highlights that expectations are adjusting more quickly than actual orders. Investors are also seeking evidence that demand for AI will deliver sustained cash flows.
Samsung Electronics KRX:005930 reported a comparable breakdown. The company’s semiconductor division posted robust profits, while executives anticipate supply constraints will persist through 2028. Despite an 8.4% intraday rally, shares ended down 0.7%.
The Moomoo post provided a retail scenario, not standalone analysis. The writer used SOXS for intraday or short-term hedging, referencing volatility and compounding decay before closing the position at a predetermined level. This mirrors the fund’s stated objective for single-day performance.
Early trading on Thursday was higher. Microsoft NASDAQ:MSFT rose almost 9% after its revenue and cloud forecast beat estimates. Meta Platforms NASDAQ:META slid 9.2% as quarterly free cash flow plunged 91%.
At 6:18 a.m. EDT, Dow futures gained 0.23%, S&P 500 futures rose 0.41%, and Nasdaq 100 futures advanced 0.86%. Apple NASDAQ:AAPL and Amazon NASDAQ:AMZN were set to release results following Thursday’s close. Guidance on their spending could impact chip valuations again.
Risks are present on both sides. A swift and smooth recovery in the sector could boost SOXL while negatively impacting SOXS. If the market recovery is unstable or directionless, both leveraged funds may underperform versus straightforward three-times projections.
The decision for investors centers on the course, not just the direction. SOXX presents focused exposure to semiconductor risk, while SOXL and SOXS introduce daily-reset mathematics on top of that already volatile foundation.