OMAHA, August 1, 2026, 12:00 p.m. CDT — U.S. markets closed.
- Berkshire Hathaway Inc. (NYSE:BRK.A; NYSE:BRK.B) Class B stock rose 3.4% over the week, ending Friday’s session at $511.54.
- FactSet places the average price target at $513.64, implying a potential upside of only 0.4%.
- The yield on the three-month Treasury bill dropped by 12.9 basis points, diminishing the expected returns on Berkshire’s large holdings of short-term assets.
Berkshire Class B shares increased from $494.93 on July 24, closing Friday at $511.54, close to their intraday peak. Trading volume totaled 3.94 million shares.
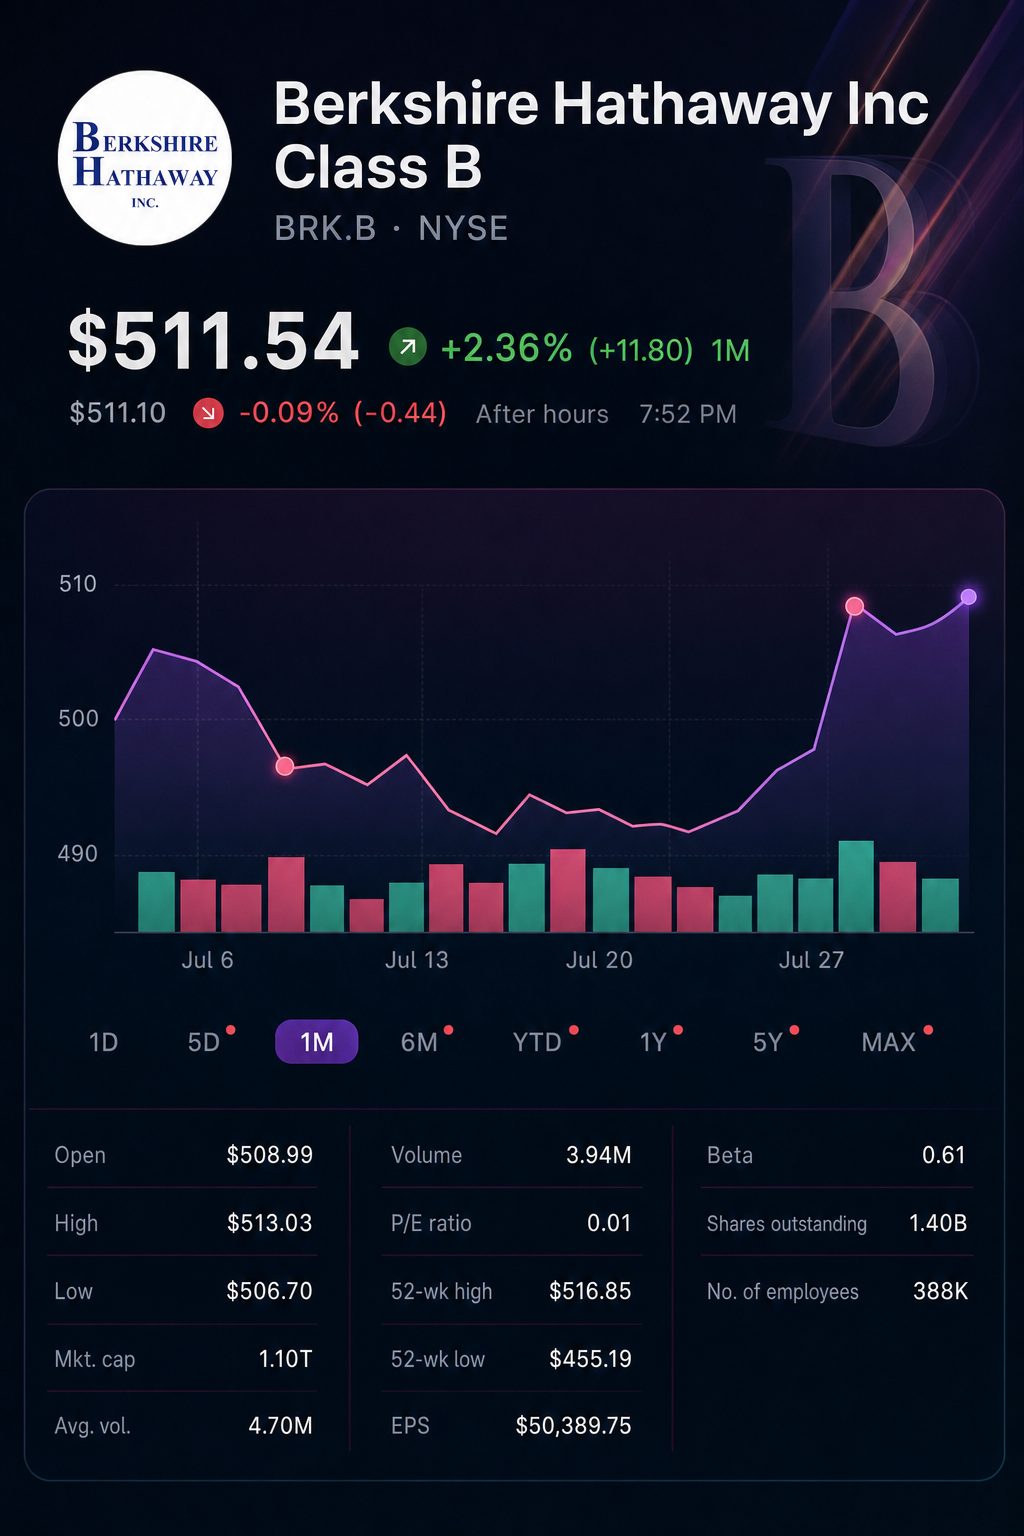
The increase brought the stock close to analyst expectations. FactSet lists a target of $513.64, just $2.10 higher than Friday’s closing value. The median target from analysts is $503, which is under the current market level.
The broader market remains ahead this year. Berkshire is lagging behind the S&P 500 by approximately 7.6 percentage points.
| Market measure | Friday close | Weekly change | 2026 change |
|---|---|---|---|
| Berkshire Class B | $511.54 | up 3.36% | up 1.77% |
| S&P 500 | 7,489.72 | gained 1.0% | advanced 9.4% |
| Dow Jones Industrial Average | 52,485.03 | rose 1.0% | climbed 9.2% |
| Nasdaq Composite | 25,373.85 | added 1.6% | up 9.2% |
Berkshire’s cash holdings reflect investor anxiety. The shares rose even as the yield on the three-month bill declined by 12.9 basis points, finishing Friday at 3.775%.
Berkshire reported $373.5 billion in net cash and Treasury bills as of March 31. Using Friday’s yield results in an initial estimate of $14.10 billion in annual gross income. The shift in weekly yield reduces that estimate by about $480 million.
This does not represent an earnings forecast. Bills have varying maturity dates, and both cash balances and tax expenses fluctuate.
| Short-rate scenario | Projected yield | Estimated annual gross proxy |
|---|---|---|
| Friday’s three-month bill yield | 3.775% | $14.10 billion |
| Yield increases by 25 basis points | 4.025% | $15.03 billion |
| Yield decreases by 25 basis points | 3.525% | $13.17 billion |
| Change for every 25 basis points | — | Roughly $0.93 billion |
The Federal Reserve on Wednesday maintained its policy range at 3.50% to 3.75%. Three policymakers expressed support for a 25 basis point hike. As a result, Berkshire’s exposure to short-term rates continues to face both upward and downward risk.
First-quarter results reflected this trade-off. Insurance investment income declined by 7.4%, even as Berkshire maintained higher Treasury bill holdings. Robust underwriting and railroad results pushed overall operating profit up 17.7%.
| Operating segment, after tax | Q1 2026 | Q1 2025 | Change |
|---|---|---|---|
| Insurance underwriting | $1.72 billion | $1.34 billion | +28.5% |
| Insurance investment income | $2.68 billion | $2.89 billion | -7.4% |
| BNSF railroad | $1.38 billion | $1.21 billion | +13.4% |
| Berkshire Hathaway Energy | $1.11 billion | $1.10 billion | +1.5% |
| Manufacturing, service and retail | $3.20 billion | $3.06 billion | +4.5% |
| Total operating earnings | $11.35 billion | $9.64 billion | +17.7% |
Berkshire’s capital allocation is modest compared to its available liquidity. The Taylor Morrison acquisition involved $6.8 billion in equity value, with an enterprise value totaling roughly $8.5 billion.
The equity value represented about 1.8% of March liquidity. Vice Chairman Greg Abel stated the merged company would “help more Americans achieve their dream of homeownership.”
Investors are focused on second-quarter results in the coming week. According to FactSet, the report is scheduled for August 3. As of midday Saturday, Berkshire’s site had not yet published the release.
FactSet’s early projection for Q2 earnings is $5.04 per Class B share, showing a 2.6% rise over the past three months. However, this figure is still under the previous year’s $5.17.
| Earnings and valuation marker | Current figure | Comparison | Difference |
|---|---|---|---|
| Q2 EPS forecast | $5.04 | $4.91 three months earlier | +2.6% |
| Q2 EPS forecast | $5.04 | $5.17 for Q2 2025 | -2.5% |
| Average price target | $513.64 | $511.54 Friday’s close | +0.4% |
| Median price target | $503.00 | $511.54 Friday’s close | -1.7% |
| Top price target | $585.00 | $511.54 Friday’s close | +14.4% |
| Lowest price target | $463.57 | $511.54 Friday’s close | -9.4% |
Investors are set to monitor the latest cash position and the scale of share buybacks. Performance in underwriting margins, BNSF shipment levels, and Taylor Morrison’s impact will be key factors. Berkshire’s stock portfolio could once again cause significant fluctuations in stated net income.
Risks: Earnings may face pressure from catastrophe losses, declining short rates and softer rail demand. Utility regulation continues to be a limiting factor. Furthermore, equity-market fluctuations can impact quarterly GAAP profit.
The straightforward valuation gap has mostly narrowed following last week’s rally. Additional upside could depend on more robust operating results or a quicker pace of capital deployment.