NEW YORK, August 2, 2026, 14:13 EDT
- Initial estimate: Annual costs for the new term loans may range from $607 million to $698 million at existing rates.
- AT&T anticipates that projected dividends and share repurchases will be in line with its forecast for free cash flow exceeding $18 billion in 2026.
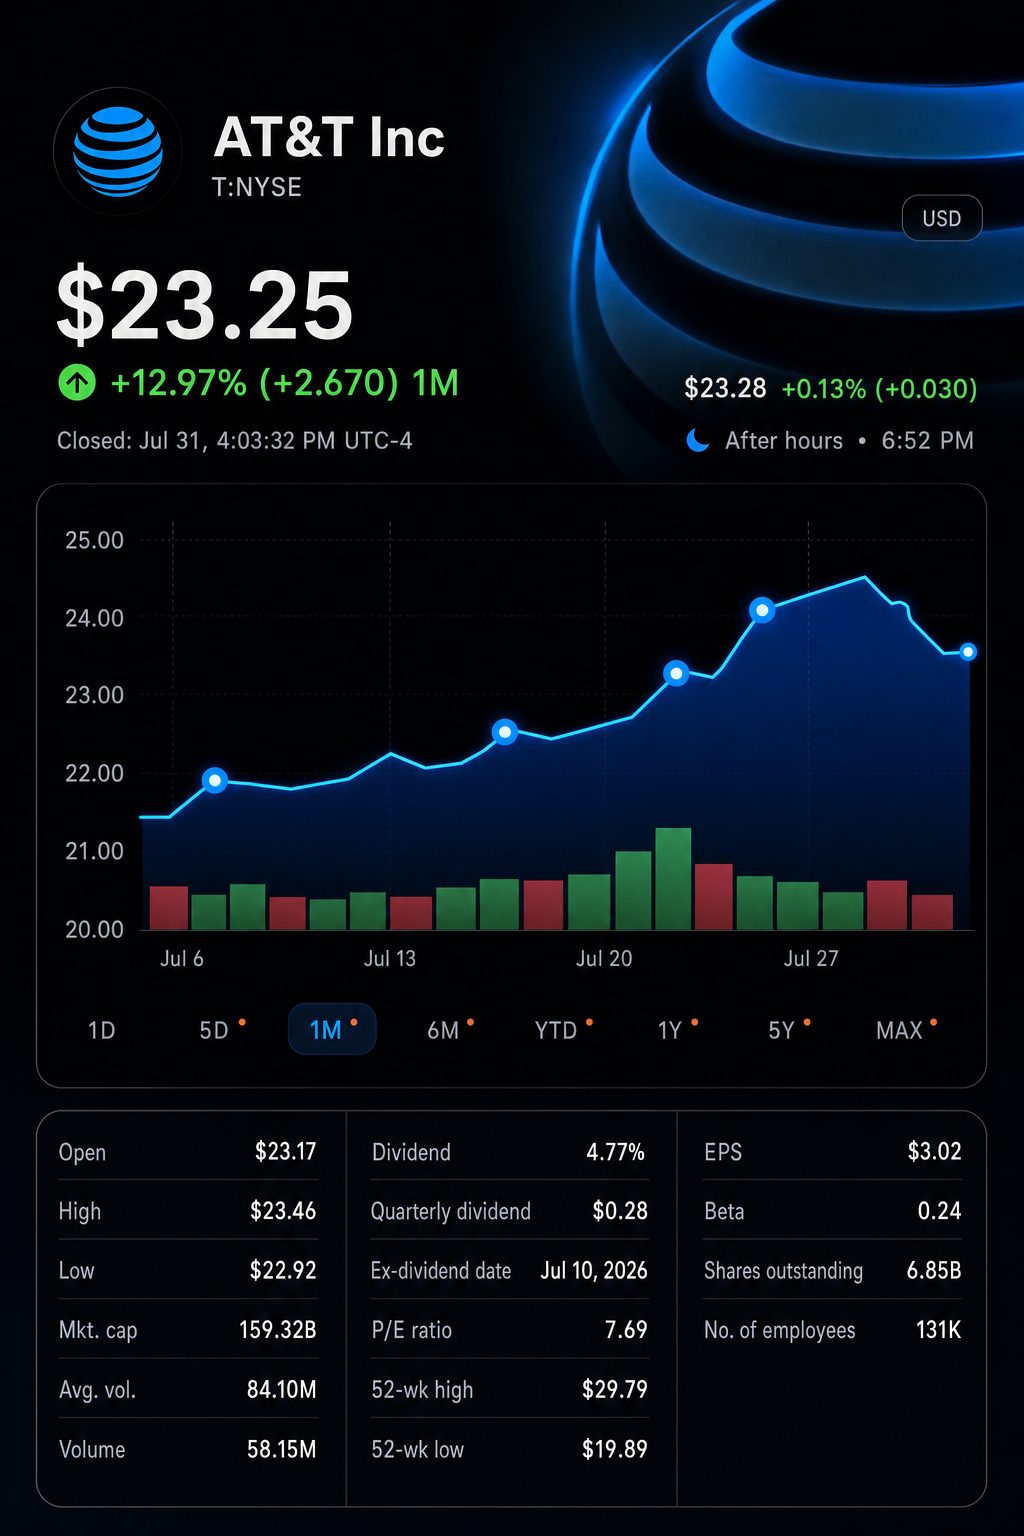
- AT&T stock declined 3.6% over the past week, as the S&P 500 rose by 1.0%.
AT&T Inc. NYSE:T starts the week holding $14.5 billion in fresh variable-rate borrowings. Forthcoming dividend and buyback commitments may consume nearly the entirety of the company’s anticipated free cash flow for 2026. U.S. markets did not open on Sunday.
Debt provided 63% of financing for a $23 billion spectrum acquisition from EchoStar Corporation NASDAQ:ECHO. The facility does not feature scheduled amortization. Principal repayment is required after 364 days or two years.
Example of yearly debt expense
| Facility | Principal | Contract margin over Term SOFR | Illustrative rate | Annualized interest |
|---|---|---|---|---|
| 364-day term loan | $3.0 billion | 0.450%-1.075% | 4.11%-4.73% | $123-$142 million |
| Two-year term loan | $11.5 billion | 0.550%-1.175% | 4.21%-4.83% | $484-$556 million |
| Total | $14.5 billion | — | — | $607-$698 million |
The initial estimate is based on the one-month Term SOFR rate of 3.66% from Friday. The final cost is determined by the rate that AT&T selects and its debt ratings.
The expense represents 3.4% to 3.9% of the $18 billion minimum cash flow. While not overwhelming, it makes capital allocation calculations more challenging.
Chief Executive John Stankey stated that stepped-up buybacks demonstrate “confidence in our market position.” The leadership has set a new goal of around $10 billion in 2026 repurchases. Total outlays for dividends and buybacks are projected at approximately $18 billion. AT&T Newsroom
AT&T’s announced cash strategy
| Measure | 2026 | 2026-2028 |
|---|---|---|
| Free-cash-flow forecast | $18 billion or more | At least $58 billion based on annual minimums |
| Expected shareholder payouts | Approximately $18 billion | More than $45 billion |
| Straight difference | Close to zero at the 2026 baseline | Roughly $13 billion |
| Principal of new term loan | $14.5 billion | Payable within two years |
The basic distinction does not represent a liquidity prediction. Both multi-year numbers include “plus” symbols, and AT&T retains the ability to refinance its obligations. However, the comparison highlights a restricted margin. AT&T Newsroom
Management anticipates net leverage increasing from 2.68 times to approximately 3.2 times. The company aims for around 2.5 times over a three-year horizon. Net debt for the second quarter was $126.4 billion ahead of the spectrum closing.
Last week, shares showed signs of that strain. AT&T dropped 3.6%, as the S&P 500 rose 1.0%. Between Tuesday’s close of the deal and Friday, AT&T slipped 5.7%.
Week concluding July 31
| Security | Friday close | Friday move | Weekly move |
|---|---|---|---|
| AT&T Inc. NYSE:T | $23.25 | up 0.17% | down 3.6% |
| Verizon Communications Inc. NYSE:VZ | $46.81 | up 1.52% | up 0.9% |
| T-Mobile US Inc. NASDAQ:TMUS | $172.71 | down 0.36% | down 4.1% |
| S&P 500 | 7,489.72 | up 0.70% | up 1.0% |
Closing prices for the regular session and weekly variations are based on July 24 closing values.
The company’s operating performance continues to outpace its share price. AT&T reported an increase of 432,000 postpaid phone subscribers in the second quarter, along with a gain of 646,000 fiber and fixed-wireless internet customers. Free cash flow climbed to $4.7 billion.
Operating comparison for the second quarter
| Company | Customer-growth metric | Service-revenue growth | Adjusted EBITDA growth | Free cash flow |
|---|---|---|---|---|
| AT&T | 432,000 net postpaid phone additions | 2.7% | 5.2% | $4.7 billion |
| Verizon | 184,000 net postpaid phone additions | 2.8% in mobility and broadband | 7.2% | $6.4 billion |
| T-Mobile | 277,000 net postpaid account additions | 8.9% growth in total service revenue | 11.7% increase in core adjusted | $4.8 billion adjusted |
T-Mobile discloses account growth, rather than phone subscriber growth. Service revenue is defined differently by each carrier.
AT&T recorded more phone additions than Verizon. However, Verizon and T-Mobile delivered higher adjusted EBITDA growth. The spectrum investment needs to translate customer growth into sustained cash generation.
The $0.2775 common dividend issued on Monday applies to shareholders on record as of July 10. Investors purchasing shares this week are not eligible for this payout. The upcoming jobs report on Friday is of greater significance for floating-rate bondholders.
A Reuters survey projects 83,000 added payrolls for July and unemployment at 4.3%. On Friday, futures priced in a 64% probability of a rate hike in September. A more robust jobs report may push SOFR and increase AT&T’s funding costs.
Risks: An increase in short-term rates would drive up variable interest expenses. Any slowdown in spectrum rollout may postpone deleveraging efforts. Improved subscriber growth, greater cash conversion or reduced rates would help relieve pressure.
Investors have a straightforward test in the short term. AT&T needs to support growth, maintain its dividend, and lower its debt. The speed of share repurchases will indicate which priority is compromised first.
Related articles: NYSE:T