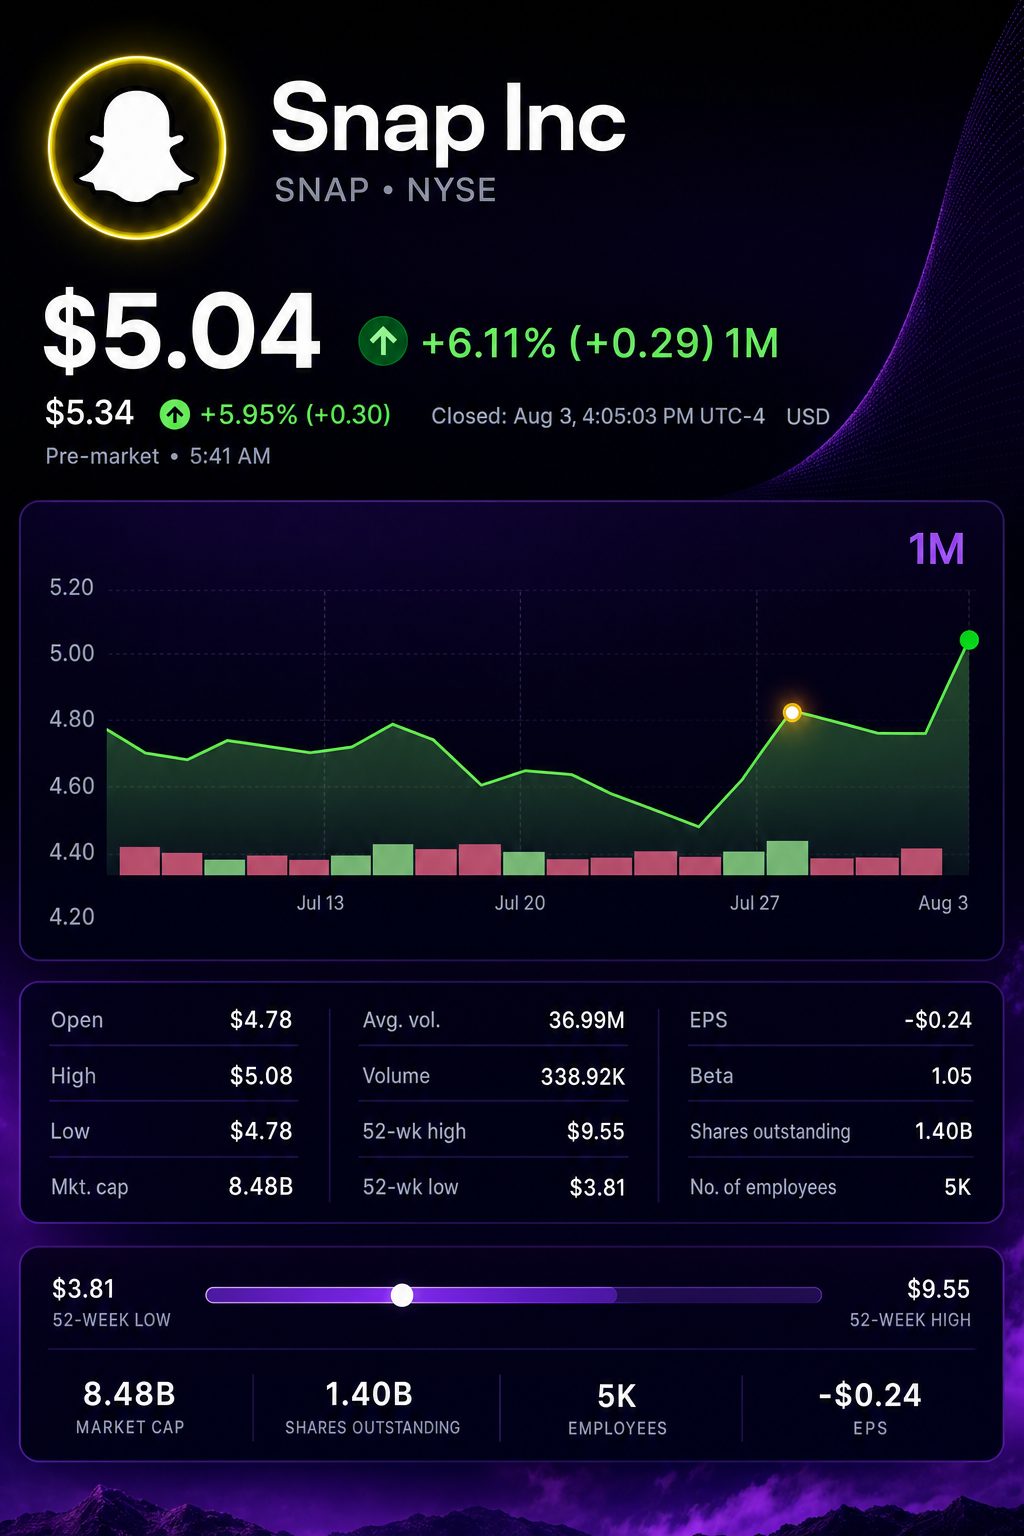
NEW YORK, August 4, 2026, 05:05 EDT — Snap NYSE:SNAP shares advanced in U.S. premarket trading after the company’s Q2 results topped estimates, as non-ad revenue contributed the largest portion of its growth.
- Shares of Snap rose 8.5% from Monday’s close to trade at $5.47.
- Snap Inc. posted a 19% increase in second-quarter revenue to $1.599 billion, exceeding the consensus estimate of $1.54 billion.
- According to rounded company figures, roughly 57% of the yearly sales growth came from non-ad revenue.
Snap stock climbed further in premarket trading on Tuesday after the company reported revenue and user numbers ahead of expectations. On Monday, shares had already risen 7.5%.
The clearest signal for investors was seen in revenue quality. Non-advertising revenue accounted for roughly 57% of the annual sales growth.
This eased Snap’s reliance on ad revenue over the quarter. However, World Cup campaigns provided a boost to performance, though management did not specify the extent of the impact.
Q2 operational summary
| Metric | Q2 2026 | Q2 2025 | Consensus | Result |
|---|---|---|---|---|
| Revenue | $1.599 bln | $1.345 bln | $1.54 bln | up 19%; 3.8% above forecast |
| Advertising revenue | $1.28 bln | $1.174 bln | $1.23 bln | up 9%; 4.1% ahead |
| Other revenue | $316 mln | $171 mln | — | up 85% |
| Daily active users | 493 mln | 469 mln | 488 mln | up 5%; 1.0% above estimates |
| Adjusted EBITDA | $250 mln | $41 mln | — | up 505% |
| Free cash flow | $121 mln | $24 mln | — | up 407% |
The premarket indication was at $5.47, up 16.6% from Friday’s closing price. This would increase Snap’s market capitalization by about $1.4 billion.
The composition shifted quickly. Other revenue contributed approximately $145 million, compared to about $109 million generated from advertising.
Revenue composition, based on company numbers rounded to the nearest value
| Revenue stream | Q2 2025 | Q2 2026 | Q2 2026 mix | Share of sales growth |
|---|---|---|---|---|
| Advertising | $1.174 bln | Roughly $1.283 bln | 80.2% | Roughly 43% |
| Other revenue | $171 mln | $316 mln | 19.8% | Roughly 57% |
| Total | $1.345 bln | $1.599 bln | 100% | 100% |
Other revenue accounts for close to 20% of total sales. Snap reported that under 3% of its monthly active users are paying subscribers. CEO Evan Spiegel stated, “free cash flow per share will be our primary financial objective going forward.” Q4 CDN
The focus on cost control intensified the shift in mix. Adjusted costs climbed 4%, as revenue advanced 19%. Gross margin widened by seven percentage points to reach 58%.
Earnings and cash flow generation
| Metric | Q2 2025 | Q2 2026 | Change |
|---|---|---|---|
| Gross margin | 51% | 58% | up 7 percentage points |
| Adjusted EBITDA margin | 3% | 16% | up 13 percentage points |
| Free cash flow | $24 mln | $121 mln | rise of 407% |
| Free-cash-flow margin | 1.8% | 7.5% | up 5.8 percentage points |
| Net loss | $263 mln | $164 mln | reduced by 38% |
Chief Financial Officer Doug Hott stated the cost adjustments had become “increasingly visible in our results.” Snap has generated positive free cash flow for the past eight quarters in a row. StockAnalysis
Growth in user numbers continues to show imbalance. Rest-of-world regions gained 32 million DAUs, while North America and Europe together saw a decline of eight million.
Regional monetization
| Region | DAU: Q2 2025 → Q2 2026 | ARPU: Q2 2025 → Q2 2026 | Revenue growth |
|---|---|---|---|
| North America | 98 mln → 92 mln, a decrease of 7% | $8.33 → $10.26, a 23% increase | +15% |
| Europe | 100 mln → 98 mln, down 2% | $2.65 → $3.62, up 36% | +33% |
| Rest of World | 271 mln → 303 mln, rising 12% | $0.96 → $1.00, a 4% rise | +17% |
| Global | 469 mln → 493 mln, gain of 5% | $2.87 → $3.25, advancing 13% | +19% |
Revenue increased as higher monetization balanced audience declines in mature markets. ARPU in North America climbed 23%, and European ARPU advanced 36%. Growth in revenue occurred even though user bases were smaller.
Snap projected third-quarter revenue in the range of $1.70 billion to $1.74 billion, with the midpoint indicating 14.1% growth and about 1.2% ahead of analyst consensus. Adjusted EBITDA guidance was set at $300 million to $350 million, bracketing the estimate of $329.9 million.
Snap posted improved ad efficiency, with app purchase volumes climbing 128% and cost per purchase declining 18%. Revenue from Dynamic Product Ads was up 43%. The company continues to face strong competition, notably from Meta Platforms NASDAQ:META.
Snap plans to share further information about its $2,195 Specs glasses on September 16. The company also increased its full-year infrastructure cost outlook by $50 million at the midpoint.
Risks: Expenditure related to the World Cup might not recur. Daily active users in established markets are declining, and upcoming regulations on privacy, safety, and age could limit user interaction. Investments in specifications and artificial intelligence infrastructure may require more funding than anticipated.
Snap’s revenue quality and cash conversion saw improvement during the quarter. For a sustained rerating, gains in non-ad revenue and increased ARPU must offset declines in mature-market users.
Related articles: NYSE:SNAP





Further analysis
Did Snap's second-quarter results significantly change the company's growth prospects?
Revenue increased 19% to $1.60 billion, surpassing the $1.54 billion consensus forecast. The Q3 midpoint of $1.72 billion suggests growth of around 14%, just above consensus. Increased spending during the World Cup supported Q2 results. Focus now shifts to sustainability. Snap Inc. Investor Relations
Is there still significant upside potential at the premarket valuation?
Snap shares were last seen near $5.48 before the bell, giving the company an equity valuation close to $9.2 billion. That reflects about 1.45 times its trailing revenue and a 7.7% free cash flow yield. Analysts' average price targets of $7.21–$7.42 point to potential gains of 32%–35%. Neutral or Hold recommendations and a target spread from $4 to $15 highlight sharp differences in opinion. Results due August 3 could prompt analysts to adjust their forecasts. Investing.com
Is it possible to boost profitability while maintaining per-share value?
Adjusted EBITDA rose to $250 million from $41 million a year ago. The third-quarter outlook of $300–$350 million includes the $329.9 million consensus. Trailing free cash flow totaled $706 million, while Q2 stock-based compensation amounted to $263 million. The number of common shares and shares tied to awards increased by 3%, despite $601 million spent on share buybacks. Forecasted infrastructure costs were raised to $1.65–$1.70 billion. Snap Inc. Investor Relations
Could increased monetization make up for declining user numbers in Snap’s primary markets?
Global DAUs increased by 5% to reach 493 million, with growth led by Rest of World. DAUs in North America declined 7%, while European DAUs slipped 2%. These two markets continued to account for around 81% of total revenue. ARPU climbed 23% and 36%, raising regional revenue by 15% and 33% respectively. User attrition remains a concern. Snap Inc. Investor Relations
Which appears to be the stronger catalyst: subscriptions or Specs?
Revenue from other sources, such as subscriptions, climbed 85% to $316 million, accounting for close to 20% of overall sales. Advertising revenue increased 9% to reach $1.28 billion. Specs will launch this fall priced at $2,195, with further information to be released on September 16. It is still unclear whether consumer demand will materialize. The Wall Street Journal