
NEW YORK, August 4, 2026, 06:10 EDT — SoFi Technologies NASDAQ:SOFI stock recovered 10.5%, coming off previous losses, while the company’s EBITDA outlook places a 29% performance benchmark under investor scrutiny.
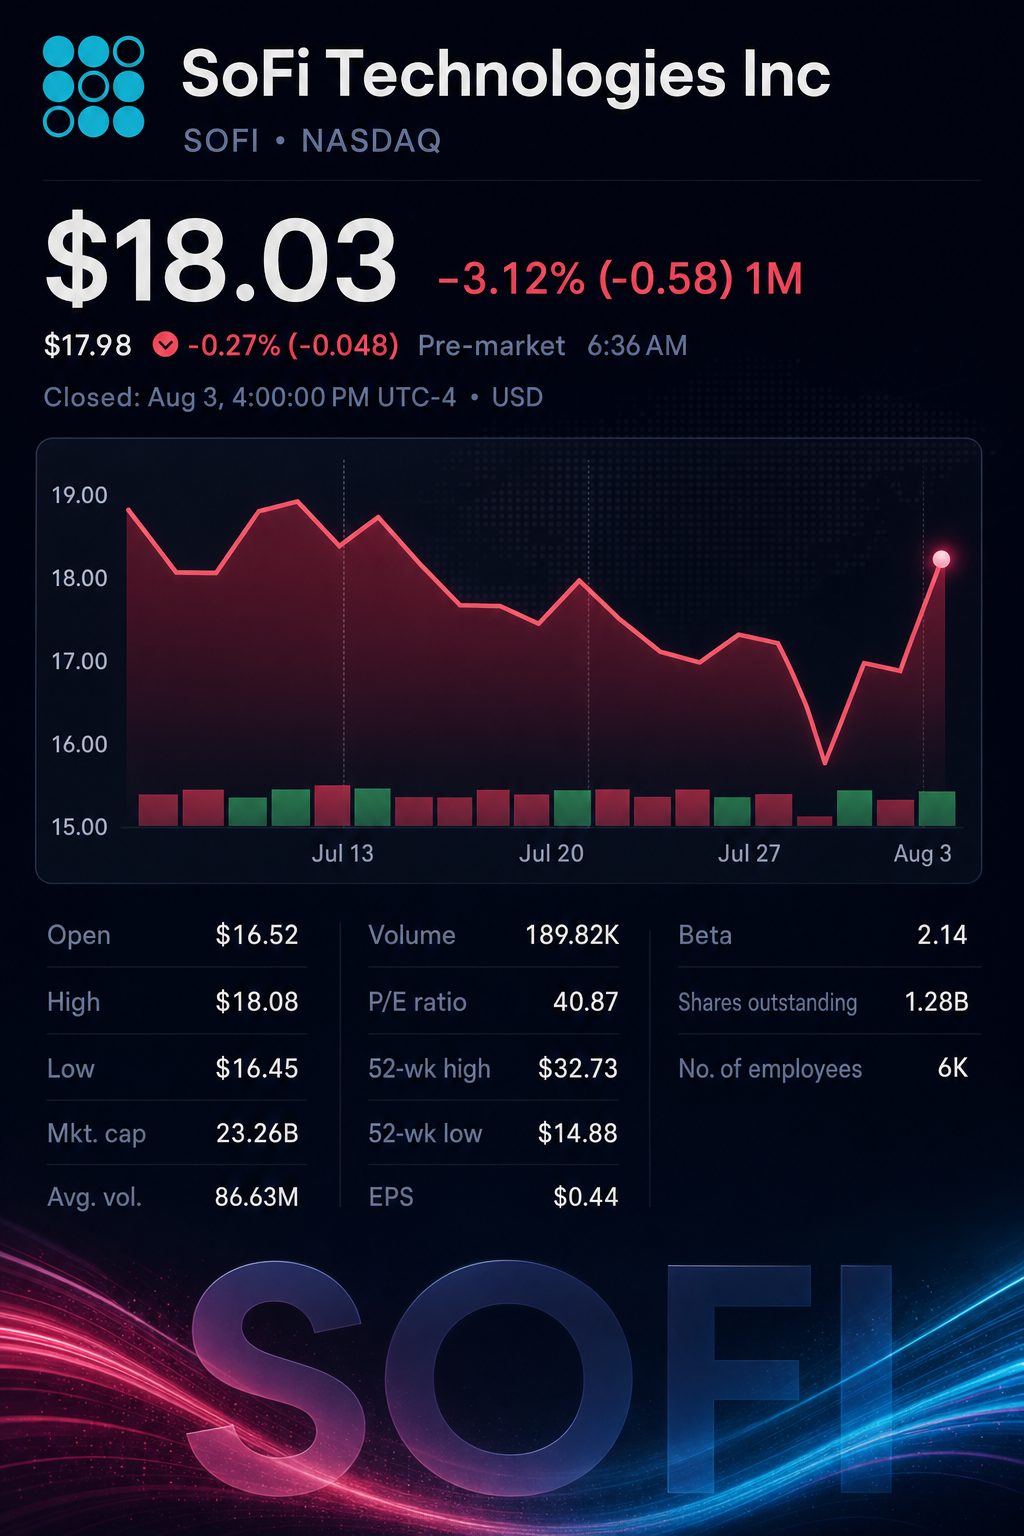
- SoFi ended Monday at $18.03, rising 10.55%. The Nasdaq Composite advanced 2.13%.
- The annual guidance indicates adjusted EBITDA for the second half will reach about $902 million, 29% higher than what was recorded in the first half.
- Lending revenue increased by 63% during the second quarter, while Technology Platform revenue declined by 23%.
SoFi Technologies, Inc. NASDAQ:SOFI saw its shares rise 10.55% in premarket trading on Tuesday, following a Monday close at $18.03. This increase reversed the drop from the previous week.
The key issue for investors is how profits are converted. SoFi’s guidance for the full year suggests that adjusted EBITDA for the second half will be about $902 million, which is 29% higher than the figure reported in the first half.
Revenue does not need to accelerate significantly. The targets suggest a 7% to 12% increase in revenue in the second half compared with the first half. SoFi has to generate higher earnings per revenue dollar.
U.S. premarket trading opened at 06:10 EDT. The Nasdaq regular session will start at 09:30 EDT. On Monday, SoFi’s increase was about five times greater than the index’s advance.
The recovery came after a turbulent week for earnings. The highest selling volume was recorded on July 29, coinciding with SoFi’s results release.
| Session | Close | Daily move | Volume |
|---|---|---|---|
| July 28 | $16.74 | -0.83% | 83.1 million |
| July 29 | $15.25 | -8.90% | 193.6 million |
| July 30 | $16.47 | +8.00% | 83.2 million |
| July 31 | $16.31 | -0.97% | 56.4 million |
| August 3 | $18.03 | +10.55% | 83.3 million |
The stock declined 0.9% between Friday, July 24, and July 31. Monday’s rebound occurred with earnings-day volume at less than half its usual level.
SoFi increased its 2026 adjusted net revenue forecast to a range of $4.75 billion to $4.85 billion. The company maintained its adjusted EBITDA target at approximately $1.6 billion. Guidance for adjusted earnings per share also remained around 60 cents.
The result is a significant gap to bridge in the second half.
| Adjusted measure | First-half actual | 2026 target | Implied second half | Change versus first half |
|---|---|---|---|---|
| Net revenue | $2.293 billion | $4.75 billion-$4.85 billion | $2.457 billion-$2.557 billion | Increase of 7.2% to 11.5% |
| EBITDA | $697.7 million | About $1.60 billion | About $902.3 million | Up 29.3% |
| Net income | $327.1 million | About $825 million | About $497.9 million | Up 52.2% |
| Diluted EPS | $0.24 | About $0.60 | About $0.36 | Up 50.0% |
The projected EBITDA margin for the second half is between 35.3% and 36.7%, compared with a margin of 30.4% in the first half. The estimates are based on company target figures, rather than quarter-by-quarter guidance.
The operating mix highlights the opportunity and also identifies the areas under pressure.
| Segment | Second-quarter revenue | Year-on-year change | Contribution margin |
|---|---|---|---|
| Lending | $724.8 million | up 63% | 55% |
| Financial Services | $466.3 million | rose 29% | 46% |
| Technology Platform | $84.5 million | fell 23% | 14% |
Lending continued to drive results. The Technology Platform segment rose 13% from the previous quarter but was still much lower than a year ago. Segment totals reported by the company do not add up precisely to consolidated revenue.
Fee-based revenue totaled $472.3 million, accounting for 39% of the total. That marked a 22% rise compared to the previous quarter. Net interest income climbed 52% to $788.2 million.
Balance-sheet earnings remained the primary contributor. SoFi moved over $4.1 billion in loans off its books during the quarter through sales or transfers. Sustained investor appetite for those loans continues to play a key role.
The annualized rate of personal-loan charge-offs dropped to 2.62% from 3.03%. SoFi placed its estimated all-in rate, which does not include late-stage delinquent sales, at around 3.7%. Both figures remain key for investors to monitor.
Loan originations increased by 69% to reach $14.8 billion, which included $3.1 billion in personal loans generated on behalf of third parties.
Chief Executive Anthony Noto told Reuters, “Spending remains strong, demand remains strong, and credit performance continues to meet or exceed our expectations.” In the next two quarters, that demand will need to translate into higher margins. Reuters
Monday’s widespread rally offered support. SoFi continued to outperform two comparable fintech firms.
| Company or index | Monday close | Monday move | Trailing P/E |
|---|---|---|---|
| SoFi Technologies, Inc. NASDAQ:SOFI | $18.03 | up 10.55% | 40.1 times |
| Robinhood Markets, Inc. NASDAQ:HOOD | $90.34 | gained 4.37% | 40.0 times |
| Upstart Holdings, Inc. NASDAQ:UPST | $29.43 | rose 7.25% | 71.8 times |
| Nasdaq Composite | 25,913.90 | advanced 2.13% | — |
SoFi and Robinhood currently trade at comparable trailing earnings multiples. SoFi’s sharper rise suggests a move to catch up following earnings, rather than solely a reflection of sector beta.
SoFi’s investor calendar currently shows no scheduled company events. As a result, labor data is expected to influence the short-term credit and rate environment.
| Date and time, EDT | U.S. release | Investor relevance | |
|---|---|---|---|
| August 4, 10:00 | June job openings and labor turnover | Signals of recruitment appetite and strength of consumer activity | |
| August 6, 08:30 | Second-quarter productivity, preliminary | Indicators for wage pressures and outlook on interest rates | |
| August 7, 08:30 | July employment report | Implications for jobless levels and risks to consumer credit |
The Friday jobs report provides the strongest indication for credit markets. All listed times are in Eastern.
Risks: A slowing job market may drive up personal-loan losses. Reduced demand for loan sales could weigh on capital efficiency. Weakness in the Technology Platform gives less flexibility for the second-half margin bridge.
Related articles: NASDAQ:SOFI