NEW YORK, August 5, 2026, 16:16 EDT — U.S. regular session ended
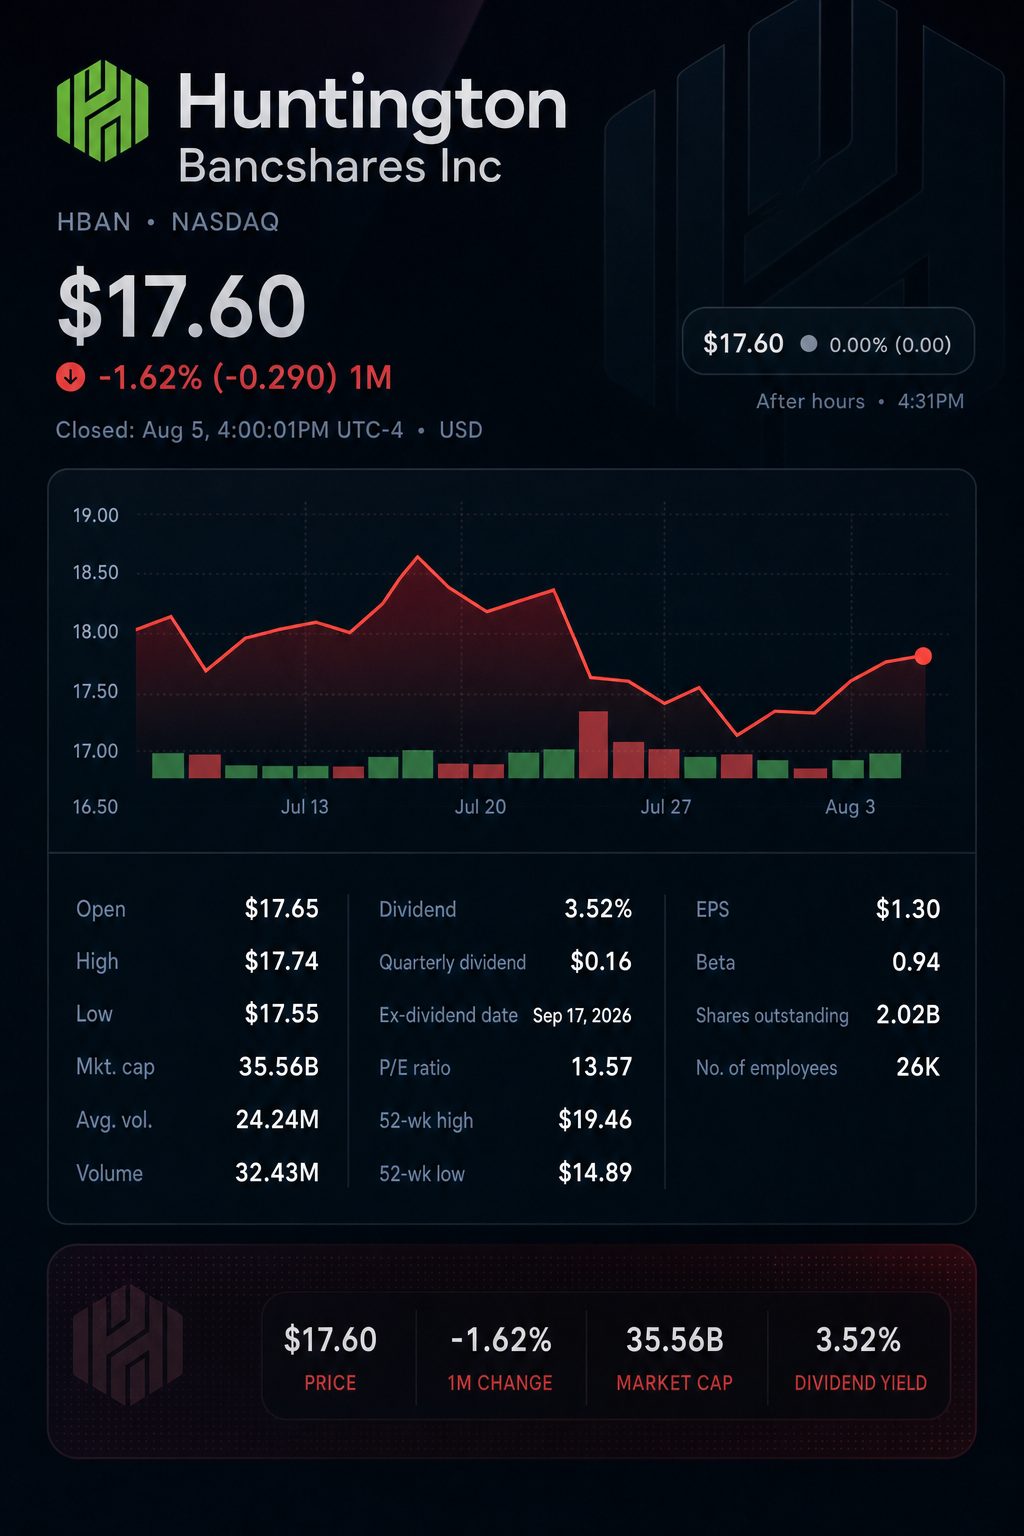
- Huntington closed at an unofficial $17.60, rising 0.2%. The stock has increased 3.3% over the week.
- An initial screening values Huntington at 1.82 times its tangible book, roughly 14% under the median of chosen peers.
- The upcoming week’s main drivers include reports on U.S. productivity, jobs, and inflation.
Huntington Bancshares Incorporated ended Wednesday’s session up 0.2% to $17.60 per share. Despite the gain, the stock continues to trade at about a 14% tangible-book discount compared to chosen regional peers.
The focus for investors shifts to fourth-quarter merger synergies, as headline balance-sheet growth may be insufficient to bridge the gap.
An initial estimate puts Huntington’s value at 1.82 times its tangible book for the second quarter. The median among four peers is about 2.12 times.
Still, Huntington delivered an adjusted ROTCE of 17.5%, surpassing the peer median by about 275 basis points. This gap highlights issues related to execution and funding, instead of indicating any softness in current profitability.
| Selected regional bank | Aug. 5 close | Q2 tangible book/share | Preliminary P/TBV | Q2 ROTCE | Q2 CET1 |
|---|---|---|---|---|---|
| Huntington Bancshares | $17.60 | $9.65 | 1.82x | 17.50% adjusted | 10.00% |
| Fifth Third Bancorp NYSE:FITB | $57.57 | $23.15 | 2.49x | 15.60% | 9.93% |
| KeyCorp NYSE:KEY | $23.09 | $13.62 | 1.70x | 12.89% | 11.20% estimated |
| Regions Financial Corporation NYSE:RF | $31.86 | $13.78 | 2.31x | 20.18% adjusted | 10.70% estimated |
| Citizens Financial Group Inc. NYSE:CFG | $73.60 | $38.29 | 1.92x | 13.91% | 10.40% preliminary |
| Four-peer median | — | — | 2.12x | 14.76% | 10.55% |
Data shows August 5 closing levels. Preliminary figures reflect the valuation multiples. Tangible book value and ROTCE represent non-GAAP metrics, with variations in issuer definitions.
Huntington posted strong momentum in the second quarter. Average loans climbed 42% from a year earlier, reaching $189.3 billion. Deposits advanced 37% to total $223.4 billion.
Net interest income rose by 40%. Noninterest income surged 67% to $785 million. Adjusted earnings stood at $0.39 per share.
| Huntington Q2 measure | Q2 value or reading | Versus Q1 | Versus Q2 2025 |
|---|---|---|---|
| Adjusted EPS | $0.39 | Up $0.02 | Up $0.01 adjusted |
| Net interest income | Saw a $161 million rise from prior quarter | 9% higher | 40% higher |
| Noninterest income | $785 million | Rising 15% | Up 67% |
| Average loans and leases | $189.3 billion | Increased by 9% | Up 42% |
| Average deposits | $223.4 billion | Higher by 9% | 37% above |
| Tangible book value/share | $9.65 | Improved by 1% | 6% higher |
| Net charge-offs | 0.25% of average loans | Declined by 1 basis point | Rose 5 basis points |
| CET1 ratio | 10.0% | Down 20 basis points | — |
Non-GAAP metrics include adjusted EPS, tangible book value, and adjusted returns.
Cadence and Veritex accounted for a large portion of the balance-sheet growth. As a result, organic revenue and funding costs provide a clearer picture than overall size. Huntington finished the Cadence systems conversion during mid-June.
CEO Steve Steinour established a firm timeline. “By the fourth quarter, the full earnings power of these partnerships will be clearly evident,” he said. PR Newswire
Analysts hold differing views on that commitment. Morgan Stanley NYSE:MS downgraded Huntington to Equal Weight following the earnings report. The firm pointed to deposit-pricing pressure, as the bank boosts funding in advance of projected loan growth in the latter half.
| Post-earnings action | Firm and analyst | Recommendation | Price target |
|---|---|---|---|
| July 28 | Truist Financial NYSE:TFC, Brian Foran | Buy; target increased | $20 from $19 |
| July 27 | Bank of America Corporation NYSE:BAC, Ebrahim Poonawala | Downgraded to Neutral from Buy | $18.50 from $20 |
| July 24 | Stephens, Matt Olney | Equal Weight | $19 from $20 |
| July 24 | Morgan Stanley, Manan Gosalia | Downgraded to Equal Weight from Overweight | $19 from $21 |
| July 24 | Robert W. Baird, David George | Outperform | $21 from $20 |
These measures provide necessary context following the results and are not events from the preceding 48 hours.
The broader analyst consensus is positive. According to MarketBeat, there are 15 buy ratings, 7 holds, and a single sell on record. The average price target stands at $20.11, roughly 14% higher than the closing price on Wednesday.
The stock dropped 1.8% last week, but has now climbed 3.3%, advancing during the first three sessions of this week.
| Trading period or catalyst | Date and time, EDT | Reading or investor focus |
|---|---|---|
| Previous trading week | July 24–31 | HBAN dropped 1.8% to $17.04 |
| Current week through Wednesday | July 31–August 5 | HBAN gained 3.3% to $17.60 |
| Q2 productivity and costs, preliminary | August 6, 08:30 | Labor cost and inflation outlook |
| July employment report | August 7, 08:30 | Views on credit appetite and interest rates |
| July consumer prices | August 12, 08:30 | Focus on deposit rates and bond markets |
| July producer prices | August 13, 08:30 | Inflation trends further up the chain |
Huntington has no corporate events on the calendar. Macro data is likely to provide the nearest catalyst. Jobs and inflation reports could swiftly shift expectations for funding costs.
Risks: The advantages from loan growth may be offset by higher deposit pricing, potentially postponing a Q4 earnings boost. Delays in integration, deteriorating credit quality, or significant rate changes could negatively impact tangible book value.
The valuation gap leaves potential for a rerating. Huntington needs to translate its increased scale from acquisitions into profits while maintaining capital levels. That is still the key challenge.