
NEW YORK, August 6, 2026, 07:06 (EDT) — Premarket trading in the U.S.
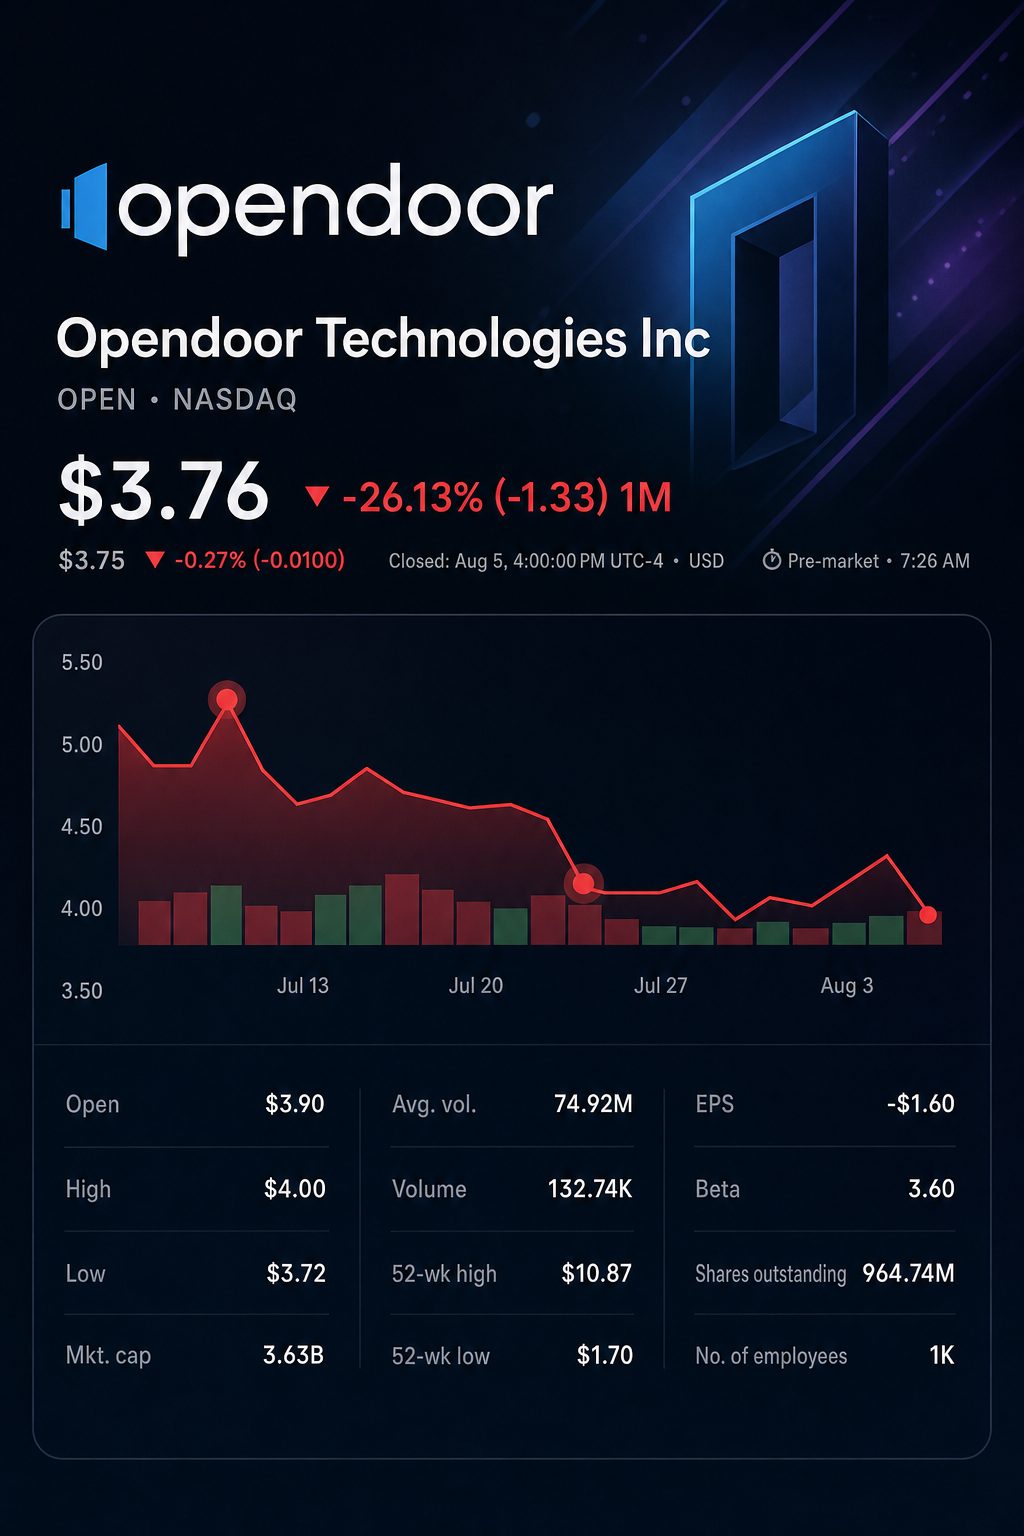
- Opendoor Technologies Inc. NASDAQ:OPEN finished Wednesday down 8.7% at $3.76. The stock was last seen at $3.74 ahead of Thursday’s opening bell.
- In the second quarter, purchases outpaced sales by 2,039 homes, aligning precisely with the quarterly rise in inventory units.
- Reporter analysis shows quarterly marketing spend per acquisition contract dropped roughly 80% compared to the first quarter.
Opendoor shares fell on Wednesday, indicating that improved unit economics were insufficient to offset the impact of increased inventory. The stock erased its gains following results, despite reporting a smaller adjusted EBITDA loss.
This is significant as Opendoor acquired 1.87 homes for each property it sold. The company recorded 4,378 purchases against 2,339 sales. The resulting shortfall of 2,039 homes was identical to the increase in inventory, which rose from 3,420 to 5,459 units.
Inventory rose by $706 million, marking a 62% increase for the quarter, and totaled $1.845 billion as of June 30. For investors, the focus shifts to how quickly assets can be resold rather than just on acquiring new customers.
The operating scorecard indicates improved quarter-over-quarter economics, though yearly sales volume is significantly reduced. Company non-GAAP metrics are shown as disclosed.
| Operating metric | Q2 2026 | Q1 2026 | Q2 2025 |
|---|---|---|---|
| Revenue | $883 million | $720 million | $1.567 billion |
| Homes acquired | 4,378 | 2,474 | 1,757 |
| Homes disposed | 2,339 | 1,921 | 4,299 |
| Contribution margin | 5.8% | 4.4% | 4.4% |
| Contribution profit per property sold | $22,000 | $17,000 | $16,000 |
| Adjusted EBITDA | $(4) million | $(31) million | $23 million |
| Inventory on market over 120 days | 9% | 10% | 36% |
Expenses increased at a quicker pace. The number of acquisition contracts climbed to 6,908 from 5,136, while marketing expenses decreased to $5 million from $19 million.
A straightforward calculation by Reuters places marketing expenditure per contract at approximately $724, down about 80% from around $3,699 in Q1.
Operations expense per acquisition close dropped significantly, falling to $3,000 from $5,000 in Q1 and $8,400 the previous year. Fixed operating expense saw a modest rise of $2 million, reaching $35 million.
The balance sheet details Opendoor’s approach to funding its resumed purchases. The debt figure here includes both current and long-term non-recourse asset-backed facilities.
| Balance-sheet metric | Dec. 31, 2025 | June 30, 2026 | Change |
|---|---|---|---|
| Net real-estate inventory | $925 million | $1.845 billion | +$920 million |
| Asset-backed debt, non-recourse | $1.120 billion | $1.762 billion | +$642 million |
| Cash plus cash equivalents | $962 million | $896 million | −$66 million |
| Total equity attributable to shareholders | $1.005 billion | $914 million | −$91 million |
Roughly 70% of the inventory growth since year-end was financed by additional debt. The company reported a first-half operating cash outflow of $964 million. Inventory accounted for $932 million of this, with net financing providing $639 million.
CFO Christy Schwartz addressed the move plainly. “We deliberately put capital to work rebuilding a larger, higher quality book,” she said. The majority of the second-quarter growth came through non-recourse facilities. StockAnalysis
The accounting trade-off is still apparent. The GAAP loss increased to $162 million, up from $29 million in the previous year. Adjusted net loss totaled $30 million, and stock-based compensation for the first half amounted to $239 million.
Analysts stay wary. The projected returns are based on Wednesday’s closing price of $3.76, according to reporter calculations.
| Analyst recommendation snapshot | Rating | Price target | Implied move |
|---|---|---|---|
| UBS Group AG NYSE:UBS, Stephen Ju — Aug. 5 | Neutral, reiterated | $4.50, reduced from $5.00 | +19.7% |
| Consensus from seven analysts | Breakdown: 3 Sell, 3 Hold, 1 Buy | $4.38 average | +16.5% |
| Consensus range, minimum target | — | $1.40 | −62.8% |
| Consensus range, maximum target | — | $8.00 | +112.8% |
UBS analyst Stephen Ju reiterated a Neutral rating and lowered his price target on Wednesday. Out of the seven ratings monitored by MarketBeat, six are listed as either Sell or Hold.
Key housing stocks showed varied performance for the week as of Wednesday, with returns measured from the close of July 31.
| Company | Wednesday close | Wednesday move | Week to date |
|---|---|---|---|
| Opendoor Technologies Inc. NASDAQ:OPEN | $3.76 | fell 8.7% | down 0.3% |
| Offerpad Solutions Inc. NYSE:OPAD | $4.61 | lost 7.2% | up 19.1% |
| Zillow Group Inc. NASDAQ:Z | $36.10 | dipped 0.5% | rose 6.0% |
| Rocket Companies Inc. NYSE:RKT | $13.86 | slipped 1.8% | gained 7.4% |
Opendoor shares dropped more sharply on Wednesday compared to Zillow and Rocket, nearing Offerpad’s 7.2% decrease. From July 24 to July 31, Opendoor had already slipped 1.8%.
The housing environment continues to face constraints. For the week ended July 31, mortgage applications declined 2.9%. Applications to purchase homes were down 3.6%, and the average 30-year fixed mortgage rate rose to 6.81%, the highest level in a year.
Opendoor is projecting annual revenue growth of no less than 20% in Q3. The company anticipates its contribution profit will at least double and sees contribution margin ranging from 4% to 4.5%.
Initial reporter calculation: the implied revenue minimum stands near $1.10 billion. This figure is based on Q3 2025 revenue at $915 million.
Management anticipates approximately $110 million in stock-based compensation for Q3. The company remains focused on achieving positive adjusted net income, measured on a 12-month forward basis, by the end of the year.
In the week ahead, investors are expected to monitor Opendoor’s acquisition metrics and the speed of property resales. The company notes that the reported contract totals reflect agreements that could potentially be cancelled.
Risks: Elevated mortgage rates may hamper resale activity and increase carrying expenses. Declining home values might result in additional inventory valuation write-downs. Substantial stock-based compensation could restrict gains in earnings per share.
Related articles: NASDAQ:OPEN