
NEW YORK, August 7, 2026, 05:10 EDT — U.S. premarket
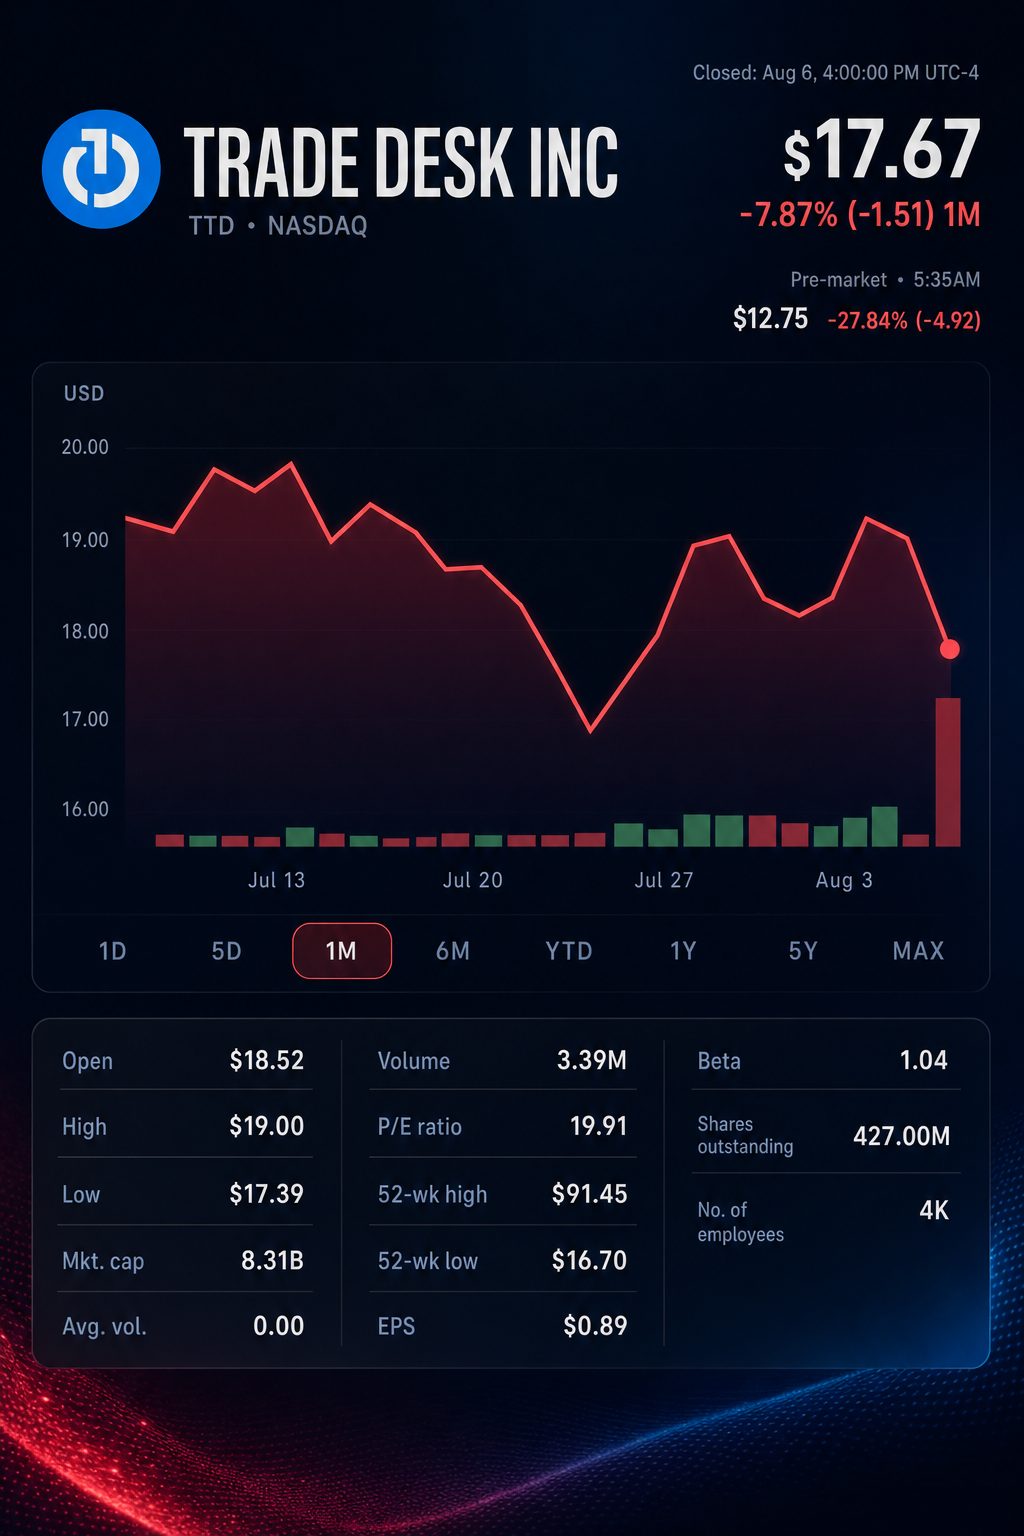
- Shares were most recently quoted at $12.70, falling 28.1% in premarket trading.
- The $650 million revenue guidance for the third quarter is 12.1% lower than a year ago and 19.4% under the consensus estimate.
- Customer retention stayed over 95%, moving focus away from churn towards spending habits and take rates.
The Trade Desk stock was set to open down 28.1% in early Friday trading. The decline came after the company posted revenue below expectations and issued a substantially lower outlook for the third quarter. Premarket levels traded beneath the previous 52-week low of $16.70.
Investor focus has shifted away from customer retention, as the company kept over 95% of its clients. However, revenue growth eased to 3%, compared with 19% in the prior year.
The gap suggests either reduced spending by existing customers, decreased take rates, or a combination of both. The company does not report revenue per client. As a result, this conclusion is inferred and not based on management guidance.
Management is forecasting third-quarter revenue of at least $650 million. This minimum is 19.4% under Wall Street’s projection of $806.5 million. At that level, the company’s EBITDA margin would be about 24.6%, compared to 42.9% a year ago.
| Period | Revenue | Year-on-year growth | Adjusted EBITDA | EBITDA margin |
|---|---|---|---|---|
| Q2 2025 | $694m | up 19% | $271m | 39% |
| Q3 2025 | $739m | up 18% | $317m | 43% |
| Q1 2026 | $689m | up 12% | $206m | 30% |
| Q2 2026 | $715m | up 3% | $241m | 34% |
| Q3 2026 guidance | No less than $650m | Around -12.1% | Roughly $160m | Approximately 24.6% |
*The growth rate and margin for Q3 2026 are based on the lower end of the guidance range.
Second-quarter revenue came in roughly 5% below consensus. Adjusted EBITDA decreased by 11%, and net income was down 29%. Diluted shares fell 5.2%, partially offsetting the per-share effect but not the overall operational decline.
Operating leverage declined. Platform operations costs climbed by 22%, about seven times faster than revenue. Overall operating expenses increased 6%, and operating income dropped 13%.
| Q2 metric | 2026 | 2025 | Change |
|---|---|---|---|
| Revenue | $715.1m | $694.0m | +3.0% |
| Platform operations | $184.3m | $151.0m | +22.1% |
| Total operating expenses | $613.5m | $577.3m | +6.3% |
| Operating income | $101.6m | $116.8m | -13.0% |
| Net income | $64.4m | $90.1m | -28.6% |
Adjustments are based on the firm’s unaudited financial data.
Chief Executive Jeff Green acknowledged the miss. “This quarter did not meet the standard we set for ourselves,” he said. The management team pledged to take firm steps, deliver platform improvements and increase execution discipline. The Trade Desk
The balance sheet reduces immediate financing risk. As of June 30, cash and short-term investments stood at $1.49 billion. Operating cash flow for the first half climbed 19.5%, even with $241 million spent on share buybacks.
Rising peer numbers challenge a solely cyclical interpretation. Leading closed-platform advertising firms posted significantly higher growth in the same quarter.
| Company and disclosure | Q2 2026 year-on-year growth |
|---|---|
| The Trade Desk — revenue from platform | 3% |
| Meta Platforms NASDAQ:META — ad revenue | 27% |
| Amazon.com NASDAQ:AMZN — ad services | 26% |
| Alphabet NASDAQ:GOOGL — Search and related advertising | 17% |
| Alphabet — YouTube ad revenue | 13% |
Differences in business models and revenue recognition methods make direct comparisons challenging.
However, the significant gap undermines the case that overall advertising demand was responsible for the full extent of the slowdown. It also increases the pressure on new commerce, streaming, and artificial intelligence products to deliver tangible revenue.
Analysts adopted a more critical tone ahead of the open. Four firms downgraded their ratings, and two newly set targets dropped beneath the premarket share price.
| Firm | New recommendation | New target | Previous position |
|---|---|---|---|
| Guggenheim | Neutral | $12 | Buy; $25 |
| Baird | Neutral | $9 | Outperform; $27 |
| Raymond James Financial NYSE:RJF | Underperform | — | Market Perform |
| Truist Financial NYSE:TFC | Hold | $16 | Buy; $35 |
Initial updates after results were posted by 05:10 EDT. Additional changes could occur during Friday’s trading hours.
Analysts at Evercore ISI, headed by Mark Mahaney, gave a more pointed assessment. The Evercore NYSE:EVR division stated the miss may indicate “significant take-rate resets or very significant share losses.” Barron’s
Risks: The revenue outlook represents a minimum, rather than a top end. Upside could come from political ads, connected TV, or a quicker pace of customer normalization. Ongoing pressure on take rates, agency client losses, or more intense competition from closed platforms could weigh on fourth-quarter and 2027 targets.
Friday’s market reaction reflects concerns over the overall quality of the franchise rather than a single quarterly disappointment. Retention rates continue to be strong. Evidence is now required to support monetization and margin recovery.
Related articles: NASDAQ:TTD