
NEW YORK, August 8, 2026, 07:58 EDT — Intel NASDAQ:INTC climbed 12.7% this week, but light trading volumes are fueling uncertainty about the rally’s sustainability.
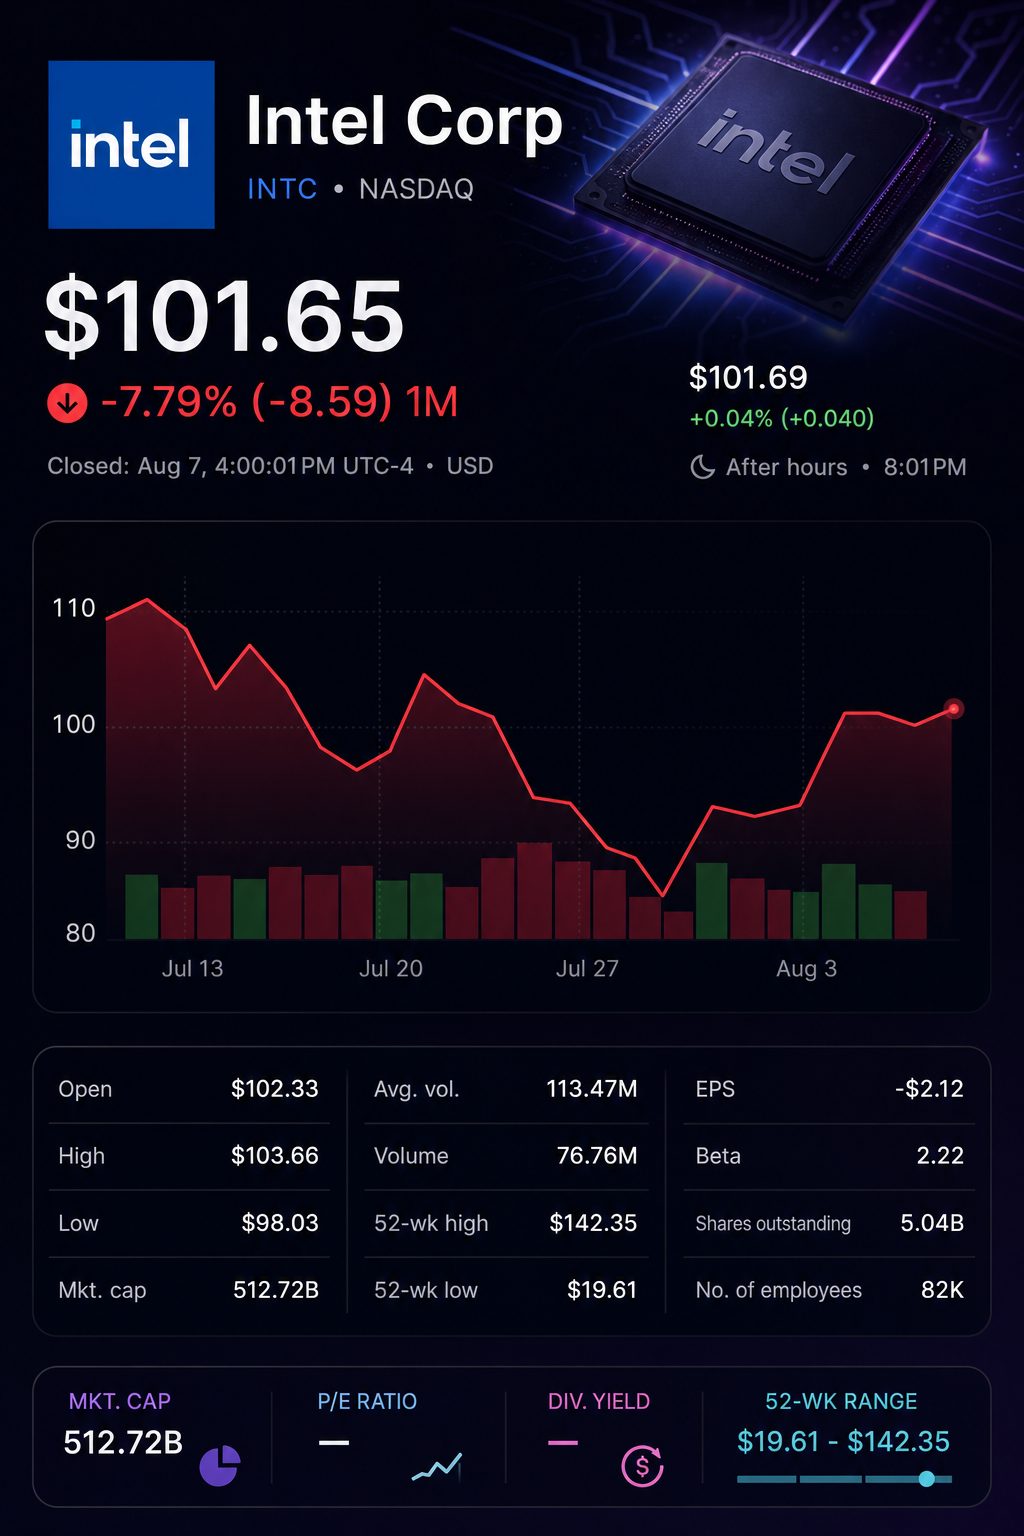
- The U.S. markets were closed. Intel closed at $101.65 on Friday, up 12.7% for the week.
- Preliminary data indicates the market value rises by approximately $58.4 billion each week.
- Tuesday was responsible for 86% of the rise. Average volume over five days fell 26.5% below the normal rate.
Intel shares advanced by $11.45 over the week, moving from $90.20 up to $101.65. At the time of reporting, U.S. markets were shut.
The increase boosted market value by an estimated $58.4 billion, based on Intel’s Q2 weighted average share count, an initial calculation shows.
NASDAQ · INTC
Intel Corporation
Gains were mainly concentrated, with nearly 86% of the week’s total advance taking place on Tuesday as technology stocks broadly rebounded. The five-day average daily volume stood at 92.2 million shares, 26.5% below the 65-day average.
Intel surpassed every major U.S. index by at least 7.5 percentage points.
| Asset | Weekly change | Intel’s lead |
|---|---|---|
| Intel | +12.7% | — |
| Nasdaq Composite | +5.2% | 7.5 points |
| S&P 500 | +3.6% | 9.1 points |
| Dow Jones Industrial Average | +3.0% | 9.7 points |
The change was primarily linked to one day of trading. On Tuesday, Intel’s share price rose by $9.86.
| Session | Close | Daily move | Volume | Share of net weekly gain |
|---|---|---|---|---|
| Monday, Aug. 3 | $91.00 | gained 0.9% | 96.63 million | 7.0% |
| Tuesday, Aug. 4 | $100.86 | surged 10.8% | 124.36 million | 86.1% |
| Wednesday, Aug. 5 | $101.06 | increased 0.2% | 85.39 million | 1.7% |
| Thursday, Aug. 6 | $99.81 | declined 1.2% | 78.09 million | -10.9% |
| Friday, Aug. 7 | $101.65 | advanced 1.8% | 76.76 million | 16.1% |
Intel said on Friday that Dean Jarnac has been named executive vice president and chief sales officer. Jarnac is set to take up the position in September.
Jarnac joins from Marvell Technology NASDAQ:MRVL. He previously held senior sales positions at Broadcom NASDAQ:AVGO and Advanced Micro Devices NASDAQ:AMD.
“Customer focus and execution are central to Intel’s strategy and future success,” Chief Executive Lip-Bu Tan said. Intel Corporation
The appointment aims at Intel’s forthcoming business challenge. Shay Boloor from Futurum Group connected additional revaluation to a pivotal outcome. Intel must “convert the current data center shortage into sustained revenue growth,” he said. Reuters
Intel reported a stronger operating performance in July. The company exceeded second-quarter expectations and issued guidance that topped analyst forecasts.
| Financial measure | Intel result or outlook | Prior consensus | Difference |
|---|---|---|---|
| Q2 revenue | $16.13 billion | $14.42 billion | up 11.9% |
| Q2 adjusted EPS | $0.42 | $0.21 | doubled |
| Q2 adjusted gross margin | 41.8% | 38.8% | increase of 3.0 points |
| Q3 revenue midpoint | $16.30 billion | $15.10 billion | up 7.9% |
| Q3 adjusted EPS outlook | $0.38 | $0.27 | up 40.7% |
FactSet NYSE:FDS analysts quickly increased their projections. This change helps explain the shift in the stock’s valuation.
| Consensus period | Current EPS estimate | One month ago | Revision |
|---|---|---|---|
| Q3 2026 | $0.39 | $0.26 | +50.0% |
| Q4 2026 | $0.42 | $0.31 | +35.5% |
| Full-year 2026 | $1.50 | $1.08 | +38.9% |
| Full-year 2027 | $2.04 | $1.58 | +29.1% |
The stock’s present valuation allows little margin for error. Shares closed on Friday at 67.8 times forecasted 2026 earnings per share, and 49.8 times expected EPS for 2027.
Opinions among Wall Street analysts vary. According to FactSet, there are 20 Buy or Overweight ratings, 31 Hold recommendations, and two analysts rate the stock as Sell. The median price target is $118.50, which implies an upside of 16.6%.
| Research firm | Recommendation | Price target | Gap from $101.65 |
|---|---|---|---|
| BofA Securities NYSE:BAC | Buy | $160 | +57.4% |
| Baird | Neutral | $125 | +23.0% |
| Wells Fargo NYSE:WFC | Equal Weight | $120 | +18.1% |
| Wedbush | Neutral | $98 | -3.6% |
| Rosenblatt Securities | Sell | $80 | -21.3% |
Latest completed transactions show values between $80 and $160.
Intel does not have any investor events scheduled for next week, its calendar shows. The July CPI report is set for release on Wednesday, while the PPI data will be published on Thursday. Applied Materials NASDAQ:AMAT is expected to report earnings on Thursday at 4:30 p.m. EDT. The company’s guidance could offer indications about Intel’s $20 billion capital spending plan.
Risks: Intel Foundry posted a $2.09 billion operational loss in Q2. Capital spending continues to rise, while the valuation remains elevated in relation to projected earnings. If the pace of new customer sign-ups eases, the rebound from reduced volumes may falter.
Currently, data shows the stock is matching higher forecasts. Sustained high trading activity and confirmation of leading foundry clients remain necessary for additional validation.
NASDAQ · Semiconductor equities
Intel Investor Dashboard
Friday close, 4:00 p.m. EDT · After-hours: $101.69 (+0.04%)
Estimate momentum has accelerated
Normalized analyst estimates. The chart indexes each EPS forecast to 100 ninety days ago, making revisions across different periods directly comparable.
| Forecast period | Analysts | Average | Low | High | Year-ago EPS | Growth |
|---|---|---|---|---|---|---|
| Q3 2026 · Sep. | 30 | $0.39 | $0.37 | $0.45 | $0.23 | +69.72% |
| Q4 2026 · Dec. | 30 | $0.43 | $0.32 | $0.53 | $0.15 | +186.19% |
| FY 2026 | 34 | $1.52 | $1.12 | $1.69 | $0.42 | +261.71% |
| FY 2027 | 40 | $2.06 | $1.41 | $3.44 | $1.52 | +35.21% |
| Forecast period | Analysts | Average | Low | High | Year-ago sales | Growth |
|---|---|---|---|---|---|---|
| Q3 2026 · Sep. | 30 | $16.42B | $16.28B | $17.03B | $13.65B | +20.27% |
| Q4 2026 · Dec. | 30 | $16.97B | $15.85B | $18.10B | $13.67B | +24.13% |
| FY 2026 | 35 | $63.04B | $58.66B | $66.17B | $52.85B | +19.28% |
| FY 2027 | 41 | $71.36B | $63.43B | $83.12B | $63.04B | +13.19% |
Consensus remains cautious
The target range is unusually wide, from $74 to $200. The average points higher, but 31 of 48 analysts still rate Intel a Hold.
| Date | Analyst | Firm | Rating | Action | Target | Implied move |
|---|---|---|---|---|---|---|
| Jul. 29, 2026 | Harlan Sur | J.P. Morgan | Maintained | $85 | −16.38% | |
| Jul. 29, 2026 | Vijay Rakesh | Mizuho | Maintained | $109 | +7.23% | |
| Jul. 29, 2026 | Vivek Arya | Bank of America | Maintained | $160 | +57.40% | |
| Jul. 29, 2026 | William Stein | Truist | Maintained | $108 | +6.25% | |
| Jul. 29, 2026 | Ruben Roy | Stifel | Maintained | $110 | +8.21% |
Valuation, balance sheet and trading data
Trailing figures are based on the latest available filings. Provider methodologies can produce small differences in adjusted earnings and valuation ratios.
Valuation
- Market capitalization$512.72B
- Enterprise value$533.28B
- Forward P/E60.90×
- Price / sales8.99×
- Price / book5.86×
- EV / sales9.35×
- EV / EBITDA43.35×
- PEG ratio0.77
- Price / free cash flow181.11×
Financial position
- Cash & equivalents$29.73B
- Total debt$50.54B
- Net debt$20.56B
- Current ratio1.60
- Quick ratio1.16
- Debt / equity0.49
- Book value / share$17.36
- Return on assets1.41%
- Return on equity−10.72%
Trading & share statistics
- Beta · 5Y monthly2.24
- 50-day moving average$110.65
- 200-day moving average$68.58
- Average volume · 20D114.39M
- Shares outstanding5.04B
- Float4.60B
- Short interest120.96M
- Short % of float2.40%
- Short ratio1.02 days
Related articles: NASDAQ:INTC