
NEW YORK, August 6, 2026, 05:02 EDT — U.S. premarket The Wall Street Journal
- Intel Corporation NASDAQ:INTC was down 1.17% in premarket trade at $99.88.
- FactSet’s consensus estimate for 2026 EPS increased by 38% over the past month to reach $1.49.
- The median price target from analysts stands at $118, with 31 out of 54 recommendations at Hold.
Intel’s drop before the bell left its recent rally intact. The stock ended above $100 for a second consecutive session after climbing 10.8% on Tuesday. Ahead of Thursday’s opening trade, the iShares Semiconductor ETF NASDAQ:SOXX slipped 0.59%.
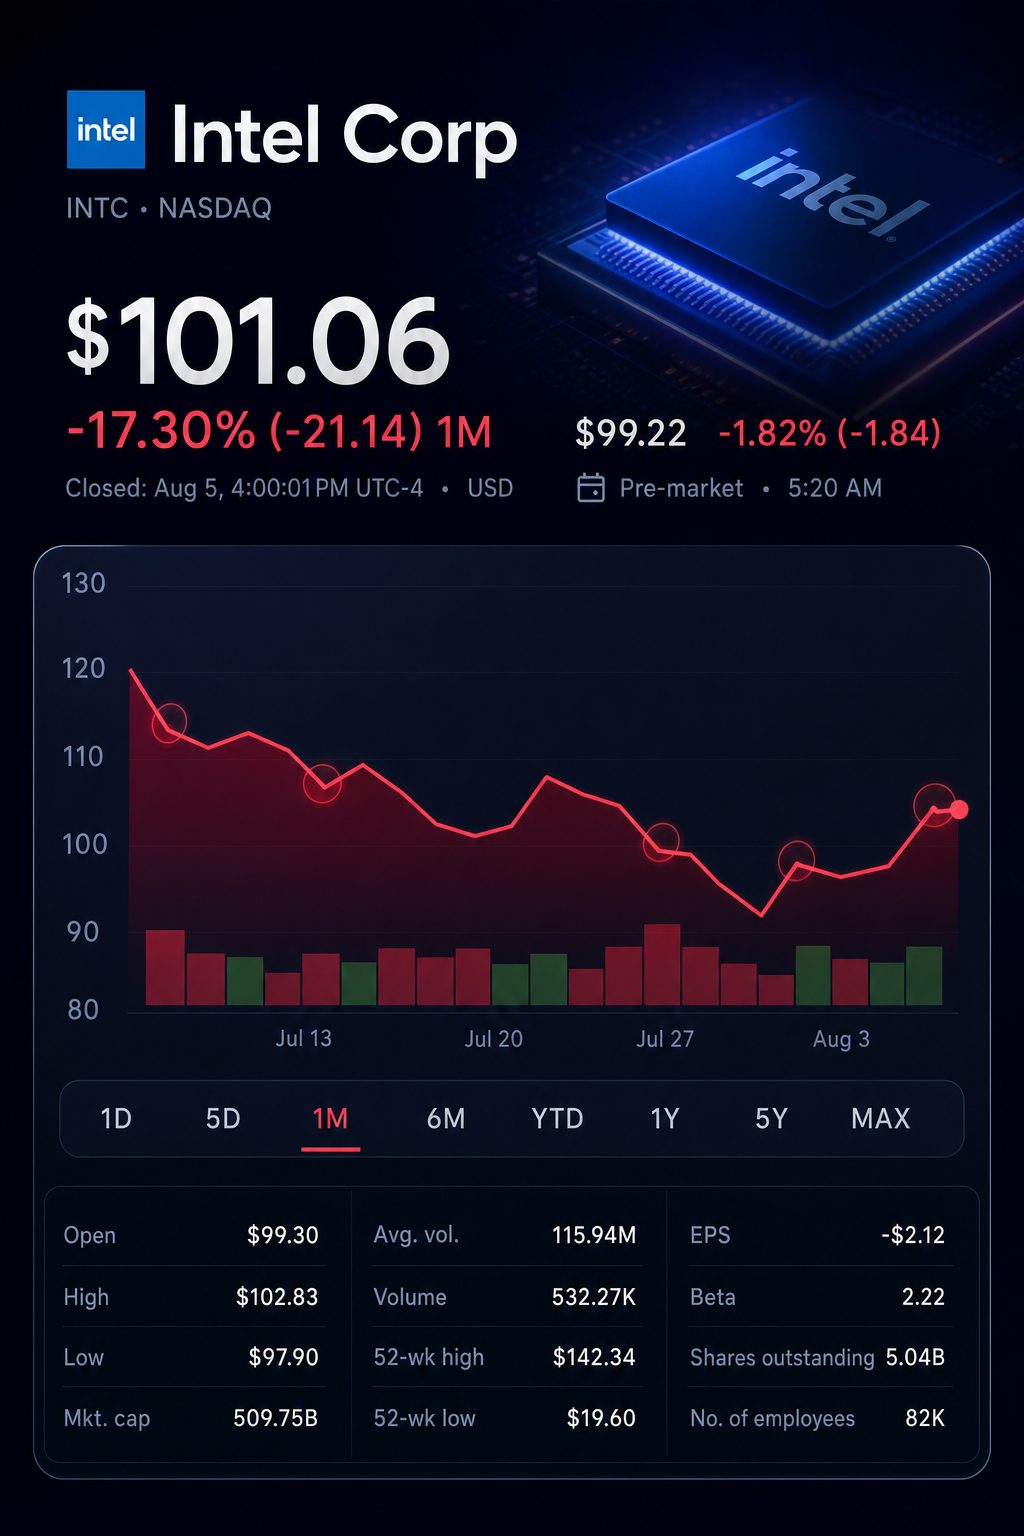
The most notable change appears in profit forecasts. Following Intel’s recent earnings, analysts have significantly raised their full-year outlook. However, the share price currently reflects expectations of a substantial rebound.
Between July 30 and August 5, Intel outperformed the chip index but lagged behind Nvidia. Price movements are based on closing figures.
| Security | July 30 | August 5 | Change |
|---|---|---|---|
| Intel Corporation NASDAQ:INTC | $91.13 | $101.06 | +10.9% |
| NVIDIA Corporation NASDAQ:NVDA | $195.04 | $219.22 | +12.4% |
| Advanced Micro Devices NASDAQ:AMD | $485.39 | $482.05 | -0.7% |
| Taiwan Semiconductor Manufacturing NYSE:TSM | $403.31 | $414.00 | +2.7% |
| PHLX Semiconductor Index | 11,302.99 | 12,008.88 | +6.2% |
Intel’s report on July 23 acted as the trigger. The company’s revenue for the second quarter landed at $16.13 billion, topping LSEG consensus estimates by 11.9%. Adjusted earnings per share came in at 42 cents, double the forecast.
Third-quarter forecasts also surpassed previous expectations. The revenue midpoint of $16.3 billion is 7.9% higher than consensus. Projected adjusted EPS of 38 cents is 40.7% above the earlier estimate. These are projections, not reported figures.
Updates from FactSet indicate the reset extends past a single quarter.
| Intel EPS projection | Latest projection | Previous month | Change |
|---|---|---|---|
| Q3 2026 | $0.38 | $0.26 | +46% |
| Q4 2026 | $0.42 | $0.31 | +35% |
| Full-year 2026 | $1.49 | $1.08 | +38% |
| Full-year 2027 | $2.04 | $1.57 | +30% |
The 2027 rise indicates analysts anticipate more than just a temporary supply shortage. Their models reflect ongoing demand and improved operating leverage, increasing the penalty for any execution errors.
Valuations continue to look elevated. The table reflects August 5 closing prices alongside consensus EPS forecasts for the present fiscal year. Note that fiscal years are not uniform.
| Company | Share price | Current-year EPS estimate | Price/EPS |
|---|---|---|---|
| Intel | $101.06 | $1.49 | 67.8 times |
| AMD | $482.05 | $7.61 | 63.3 times |
| Nvidia | $219.22 | $9.00 | 24.4 times |
| TSMC | $414.00 | $16.61 | 24.9 times |
The split of recommendations shows a less optimistic stance compared to earnings revisions. Out of 54 ratings, FactSet data indicates that 31 are Holds.
| Analyst recommendation | Current | One month ago |
|---|---|---|
| Buy | 15 | 16 |
| Overweight | 6 | 6 |
| Hold | 31 | 31 |
| Underweight | 0 | 0 |
| Sell | 2 | 3 |
| Consensus | Overweight | Overweight |
The median price target is $118, which is 16.8% higher than the closing price on Wednesday. The mean target is $121.72. UBS analyst Timothy Arcuri stated Chief Executive Lip-Bu Tan “doesn’t need much share to add multiple billions of revenue.” The Wall Street Journal
“AI is fueling record-level demand for compute,” Tan stated. Intel’s revenue from data center and AI increased 59% to $6.3 billion. Revenue from the foundry segment rose 31% to $5.8 billion. Intel Corporation
Cash continues to lag. Intel posted $7.0 billion in operating cash, but its adjusted free cash flow was negative $8.4 billion. The company also disclosed a GAAP net loss of $11.0 billion. Much of this loss resulted from a $12.5 billion mark-to-market charge.
The sector diverged on Wednesday, with AMD dropping about 7% after its forecast left investors wanting more. Nvidia rose 3.4%, and Intel inched up 0.2%. Bernstein analyst Stacy Rasgon said Intel’s performance had pushed up sector expectations.
Intel is not scheduled to hold an investor event next week. U.S. CPI data is due August 12, followed by PPI on August 13 and retail sales on August 14. The releases could impact expectations for interest rates and valuations of chip stocks.
Risks: Intel faces the challenge of transforming constrained supply and strong AI-driven demand into sustained cash flows. Significant external buy-in for its 14A foundry process remains essential. Substantial investment, restricted supply, and tough competition may hinder a rebound.
Related articles: NASDAQ:INTC