Marvell Shares Drop 10.3% Amidst Scrutiny Over AI Revenue Margins
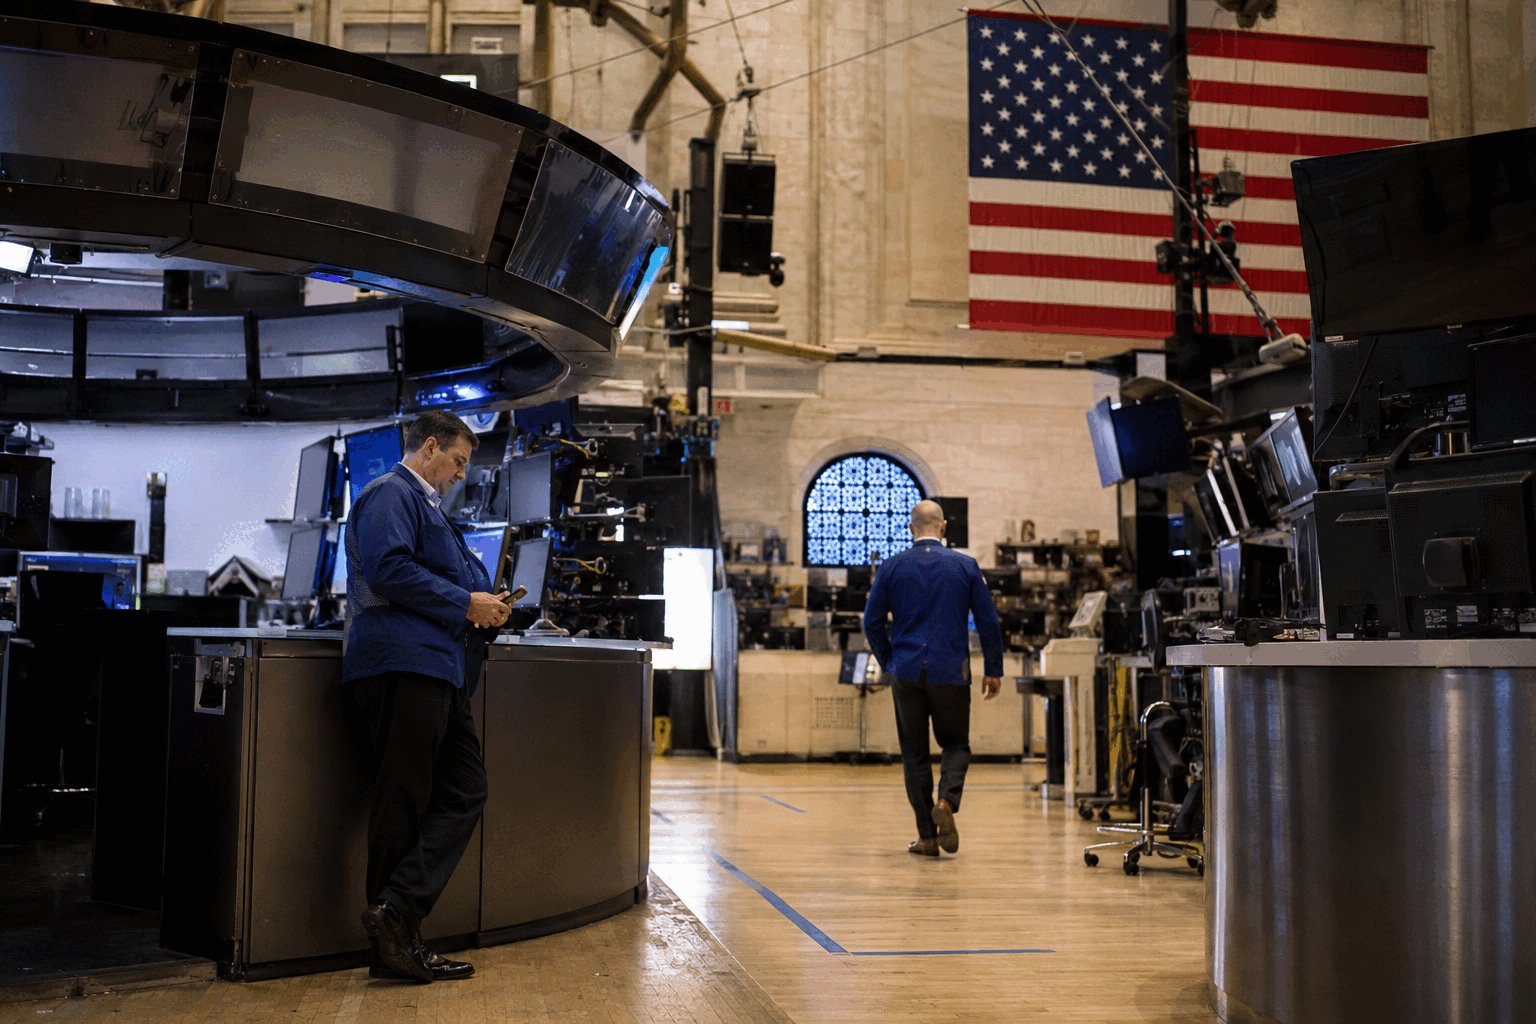
Marvell Technology fell 10.3% on Friday, wiping out approximately $22 billion in market value, after reporting its highest ever quarterly revenue.
Marvell Technology, Inc. dropped 10.28% on Friday. Shares finished at $216.62, with 48.7 million traded.
| Measure | Latest | Change / signal |
|---|---|---|
| GAAP gross margin | 53.1% | Q3 guide: 52.9%–53.9% |
| Adjusted gross margin | 58.9% | Q3 guide: 57.5%–58.5% |
| GAAP net income | $308.0M | 11.2% margin |
| Operating cash flow | $605.5M | 22.1% of revenue |
| Q3 revenue midpoint | $3.15B | ≈15% above Q2 |
| FY2028 revenue target | ≈$18B | Custom silicon-led |
Google custom-chip revenue becomes materially larger in fiscal 2029. Investor Day: Oct. 6, 2026.
Mean target: $278.89 from 44 analysts, implying 28.8% upside. Range: $126–$400.
Risks: custom-chip delays, customer concentration, margin compression, export controls and advanced-packaging constraints.
| Measure | Q2 | Q3 guide |
|---|---|---|
| Revenue | $2.739B | $3.150B ±5% |
| Non-GAAP GM | 58.9% | 58.0% midpoint |
| Non-GAAP EPS | $0.94 | $1.10 ±$0.05 |
The growth guide is strong. The 90-basis-point gross-margin step-down and Google revenue timing pushed attention toward execution.
| Metric | MRVL | Reference |
|---|---|---|
| Forward P/E | 58.4× | Broadcom 32.2× |
| Median target | $295 | +36.2% vs close |
| Ratings | 37 Buy/OW | 6 Hold · 0 Sell |
| FY28 revenue target | $18B | 6.6× Q2 run-rate quarter |
| Cash | $3.933B |
| Quarterly operating cash flow | $605.5M |
| Stock-based compensation | $326.2M |
| Q2 GAAP net income | $308.0M |
Google-linked revenue becomes more meaningful in fiscal 2029. Investor Day: Oct. 6, 2026.
| Communication services | +1.41% |
| Energy | +0.60% |
| Utilities | −1.08% |
| Technology | −1.55% |
| Gap | ≈+13% |
| Workday | +5.8% |
| Nvidia | −4.6% |
| Marvell | −10.3% |
| PayPal | −12.7% |
Sources: AP, Reuters, WSJ market data and StockAnalysis after-hours snapshot. Figures timestamped Aug. 28, 2026, 18:00 EDT unless noted.
Management lifted fiscal 2027 guidance by about $500 million and fiscal 2028 guidance by about $1.5 billion.
| Metric | Q2 FY27 | Signal |
|---|---|---|
| Revenue | $2.739B | +37% |
| Adjusted EPS | $0.94 | $0.93 est. |
| GAAP net income | $308M | +58% |
| Operating cash flow | $605.5M | 22.1% margin |
| Non-GAAP gross margin | 58.9% | Profitable scale |
| Signal | Current view | Investor meaning |
|---|---|---|
| Q3 revenue | $3.15B ±5% | More than 50% growth implied |
| Q3 adjusted EPS | $1.10 ±$0.05 | Above Q2 run-rate |
| Google contribution | Some through FY28 | Larger in FY29 |
| Investor Day | Oct. 6, 2026 | Next major detail point |
The median target offers roughly 22% upside from premarket. Forward P/E is 58.4×, versus 32.2× for Broadcom.
The fundamentals beat estimates, but not elevated AI expectations. Q3 revenue guidance exceeded consensus by about 4%, while the non-GAAP gross-margin midpoint falls 90 basis points sequentially.
| Metric | Q2 FY26 | Q2 FY27 | YoY |
|---|---|---|---|
| Revenue | $2.006B | $2.739B | +36.5% |
| GAAP operating income | $290.1M | $459.7M | +58.5% |
| GAAP gross margin | 50.4% | 53.1% | +270 bp |
| Operating cash flow | — | $605.5M | — |
| Metric | Guide midpoint | Consensus | Premium |
|---|---|---|---|
| Revenue | $3.15B | $3.03B | +4.0% |
| Adjusted EPS | $1.10 | $1.07 | +2.8% |
| Non-GAAP gross margin | 58.0% | — | −90 bp QoQ |
Revenue midpoint implies roughly 15% sequential growth.
Watch: custom-silicon ramps, optical demand, customer concentration, supply, gross-margin conversion and cash returns.
Regular close: August 26 at 16:00:01 EDT. After-hours quote: 18:03:50 EDT. Total gain from the prior close: 5.65%.
From the after-hours price, the options upper bound offered 6.2% upside. The lower bound represented 13.1% downside. The skew shows how Wednesday’s late rally consumed much of the bullish move.
Recent options signal published August 24, 2026; range recalculated from the August 26 closing price.
| Metric | Expectation / guide | Change |
|---|---|---|
| Revenue consensus | $2.71B | ≈+35% YoY |
| Adjusted EPS consensus | $0.93 | +38.8% YoY |
| Company revenue guide | $2.70B ±5% | +11.7% QoQ midpoint |
| Adjusted EPS guide | $0.93 ±$0.05 | $0.88–$0.98 |
| Non-GAAP gross margin | 58.25%–59.25% | 58.9% in Q1 |
| Diluted share count | 915M expected | Company guide |
Fiscal Q1 revenue was a record $2.418 billion. Non-GAAP net income reached $718 million, while operating cash flow hit a record $638.8 million.
| Measure | Value | Read-through |
|---|---|---|
| Trailing P/E | 84.2× | Premium leaves little room for a weak guide |
| Closing market cap / Q2 revenue | 81.3× | One quarter, not an annual multiple |
| Annualized Q2 price/sales | ≈20.3× | Assumes the quarter repeats |
| Yahoo one-year target | $266.36 | +4.9% from after-hours price |
| Susquehanna target | $265 | Positive; +4.3% from after hours |
| Rosenblatt target | $300 | Buy; +18.1% from after hours |
Price, P/E and consensus-target snapshot: August 26, 2026, 18:03:50 EDT. Fresh brokerage targets were reported August 25.
Google can buy the warrant shares at $206.58. Most vest only when product-purchase thresholds are met through fiscal 2033. Dilution is therefore tied to sales conversion.
| Company | Session move | Trailing P/E |
|---|---|---|
| Marvell | +1.97% | 84.2× |
| Nvidia | −1.52% | 31.9× |
| Broadcom | −0.33% | 97.6× |
| AMD | +0.36% | 123.6× |
Marvell sits between Nvidia and higher-multiple custom-compute peers. Its earnings must validate optical-networking growth and the custom-silicon pipeline.
Peer close data retrieved August 26, 2026, 17:52 EDT.
Expectations: An in-line quarter may not support the multiple.
Margin: Memory and optical-component costs can compress profitability.
Execution: Custom silicon ramps require long design and qualification cycles.
Dilution: Google warrants equal 6.4% of guided diluted shares.
Tape: Regular volume was only 39% of the three-month average.
Fiscal Q2 2027 results and conference call — August 27, 2026, 16:45 EDT. The market will compare any guidance raise with a $228 billion implied after-hours valuation and the 10% options move.
Sources: Yahoo Finance · Marvell Q1 results · Marvell event notice · Investopedia · Reuters
A 4.84% rally prices faster AI growth before Thursday's earnings.
Aug. 25 close
$240.38
+$11.09 · +4.84%
NASDAQ close, Aug. 25, 2026, 16:00 EDT
Premarket
$240.85
+0.20%
Delayed quote, Aug. 26, 2026, 05:01 EDT
Market value
$210.52B
Tuesday added about $9.7B
MarketWatch, Aug. 25 close
Volume
21.35M
53% of 65-day average
Aug. 25 regular session
The purchases are discretionary. The $120 billion figure is a warrant-vesting ceiling, not booked revenue or guidance.
Targets: $265, $267.82 and $300. The consensus covers 44 analysts and carries a Strong Buy rating.
A 10% move equals roughly $21 billion of market value, or 7.8 times the Q2 revenue guide.
| Measure | Latest |
|---|---|
| Q1 FY2027 revenue | $2.418B · +28% |
| Data Center revenue | $1.83B · +27% |
| Data Center share | 76% |
| Non-GAAP gross margin | 58.9% |
| Operating cash flow | $638.8M |
| Q2 revenue guide | $2.70B ±5% |
| Q2 adjusted EPS guide | $0.93 ±$0.05 |
| Term | Figure |
|---|---|
| Maximum warrant shares | 58.97M |
| Exercise price | $206.58 |
| Discount to Aug. 25 close | 14.1% |
| Potential gross proceeds | $12.18B |
| Current-share equivalent | 6.7% |
| Purchase vesting window | FYQ3 2027–FY2033 |
| Average annual threshold | About $18.5B |
Sources: market dataGoogle agreement 8-KQ1 resultsanalyst consensusearnings schedule. Calculations use company filings and the Aug. 25 close.
| Analyst | Rating | Prior | New | Vs. $240.91 |
|---|---|---|---|---|
| Susquehanna · Christopher Rolland | Buy/Positive | $230 | $265 | +10.0% |
| Rosenblatt · Sajal Dogra | Buy | $240 | $300 | +24.5% |
| Morgan Stanley · Joseph Moore | Hold | $195 | $224 | −7.0% |
| Benchmark · Cody Acree | Buy | $275 | $275 | +14.2% |
A result above the $2.70 billion midpoint must be paired with a stronger forward view to justify Tuesday’s value creation.
Custom silicon can accelerate sales while diluting gross margin. The 58.25% floor is the clean checkpoint.
Investors need evidence that optical, switching and custom-XPU bookings convert into dated revenue.
26,015.94
7,653.60
53,389.19
Decliners per advancer
The positive Dow reduces the odds of a broad liquidation. The negative Nasdaq breadth shows the pressure extends beyond one megacap.
1 Nvidia earnings risk cut AI exposure.
2 Memory and connectivity shares fell faster.
3 Long Treasury yields kept growth multiples under pressure.
Moves at 09:45 EDT. “<−6%” denotes a decline greater than 6% in magnitude.
| Firm / analyst | Rating | Target |
|---|---|---|
| Cantor Fitzgerald / C.J. Muse | Overweight | $350 |
| KeyBanc / John Vinh | Overweight | $330 |
| Rosenblatt / Kevin Cassidy | Buy | $325 |
Actions dated August 24, 2026. Friday close: $214.72. Source: Benzinga analyst tracker.
Wed, Aug. 26
Nvidia fiscal Q2 results
Wed, Aug. 26
U.S. PCE inflation
Fri, Aug. 28
Fed Chair Warsh at Jackson Hole
The core signal is breadth, not the headline index alone. A strong Nvidia report could repair semiconductor leadership quickly. An in-line result may be insufficient because positive analyst ratings already set a high bar. The main downside risk is a fresh rise in long yields, which would hit the same long-duration technology names again.
Sources: Reuters, Associated Press, Cboe and Benzinga. Intraday prices can change before the close.
Marvell's Google agreement can unlock $120 billion of purchases. The market is now weighing that scale against earnings execution and a warrant worth up to 6.3% of the post-exercise share count.
Every session last week moved at least 5.5%. That is event pricing, not a quiet repricing.
The near-term tape reflects sector caution before two major earnings events. The longer-term debate is Google's purchase ramp.
Calculated at maximum exercise. Most vesting needs $120 billion of purchases through fiscal 2033.
$120B cumulative Google purchase milestones ÷ $8.195B Marvell FY2026 revenue.
| Metric | Q1 actual | Q2 guide |
|---|---|---|
| Revenue | $2.418B | $2.700B ±5% |
| Adj. gross margin | 58.9% | 58.25%–59.25% |
| Adj. diluted EPS | $0.80 | $0.93 ±$0.05 |
| Diluted shares | — | ≈915M |
Results are due after the U.S. close on Aug. 27.
| Firm | Rating | Target |
|---|---|---|
| UBS | Buy | $310 |
| Barclays | Overweight | $275 |
| JPMorgan | Overweight | $240 |
| Raymond James | Strong Buy | $235 |
| 44-analyst average | Strong Buy | $263.94 |
Consensus upside from Friday's close: 11.4%. Published target range: $126–$400.
Market data timestamp: Aug. 24, 2026, 06:29 EDT / 12:29 CEST. Premarket and futures moves are preliminary. Sources: MarketWatch, Marvell 8-K, Marvell Q1 FY2027, StockAnalysis, Investing.com.
Strategic win Google can earn warrants as purchases scale. The agreement broadens Marvell’s custom-AI role.
Not backlog The $120B figure is a cumulative ceiling tied to 240 revenue milestones.
Expectation risk Friday’s 5.6% drop showed investors are already demanding proof.
| Measure | Value | Read-through |
|---|---|---|
| Maximum shares | 58.97M | ≈6.7% potential dilution |
| Exercise price | $206.58 | 12.9% below Friday |
| Time-based shares | 1.36M | Small fixed portion |
| Revenue tranches | 240 × $500M | $120B ceiling |
| Horizon | FY2033 | Long execution runway |
RBC expects a slight beat and a 2%–4% lift to next-quarter guidance, led by optical demand.
| Firm | View | Target | Upside |
|---|---|---|---|
| BMO | Outperform | $250 | 5.5% |
| Citigroup | Buy | $275 | 16.0% |
| Oppenheimer | Outperform | $300 | 26.6% |
| UBS | Buy | $310 | 30.8% |
| RBC | Outperform | $360 | 51.9% |
The Google deal reduces strategic doubt. It does not remove execution risk. The best near-term signal is whether Marvell converts AI bookings into revenue while keeping gross margin near 59%.
Risk: delayed purchases, tight wafer supply, weaker guidance or warrant dilution can unwind the premium quickly.
| Metric | Q1 FY27 |
|---|---|
| Revenue | $2.418bn |
| YoY growth | +28% |
| Data center | $1.833bn |
| Data-center mix | 76% |
| Non-GAAP EPS | $0.80 |
| Company | Move |
|---|---|
| Marvell | +5.79% |
| Broadcom | +0.43% |
| NVIDIA | -0.33% |
| Alphabet | -1.17% |
| Target | Value |
|---|---|
| Average | $276.38 |
| High | $400 |
| Low | $180 |
| Stock | Consensus | Avg target |
|---|---|---|
| AVGO · 48 | Strong Buy | $527.88 |
| MRVL · 43 | Strong Buy | $256.91 |
| GOOGL · 64 | Strong Buy | $427.52 |
S&P 500 • INDEXSP:SPX
Intraday, not a closing value
+45.89 points
-53.30 points
Wednesday gain ÷ Tuesday loss
Technology carried a 36.8% S&P 500 weight on July 31. Healthcare held 9.1%.
| Firm | Target | Upside | Stance |
|---|---|---|---|
| Citigroup | 8,100 | 4.7% | Constructive |
| JPMorgan | 8,000 | 3.4% | Constructive |
| Goldman Sachs | 8,000 | 3.4% | Constructive |
| UBS | 7,900 | 2.1% | Constructive |
Upside is measured against 7,737.65. “Constructive” summarizes targets above the market, not a formal index rating.
| Holding | Analyst | Call | Target | Date |
|---|---|---|---|---|
| Nvidia | Ruben Roy · Stifel | Buy | $282 | Aug. 19 |
| Broadcom | Atif Malik · Citi | Buy | $500 | Aug. 19 |
| TSMC | Haas Liu · BofA | Buy | — | Aug. 18 |
| Micron | Timothy Arcuri · UBS | Buy | $1,625 | Aug. 18 |
| Marvell | Tore Svanberg · Stifel | Buy | $350 | Aug. 18 |
The headline $12.18 billion is the maximum exercise value. Nearly all shares vest only as Google purchases custom products through fiscal 2033.
| Metric | Snapshot |
|---|---|
| MRVL premarket | >+11% |
| AVGO premarket | >-3% |
| Last verified MRVL close | $234.33 |
| Consensus rating | Strong Buy |
| Average target | $256.91 |
| Target range | $126–$400 |
| Checkpoint | Value |
|---|---|
| Q1 FY2027 revenue growth | +28% |
| Q1 data-center revenue | $1.83B |
| Data-center share of Q1 sales | 76% |
| Q2 FY2027 revenue guide | $2.70B ±5% |
| Next earnings | Aug. 27, 2026 |
Watch: warrant accounting, contract margins, customer concentration and any change to the $2.70B quarterly guide.
Risk frame: Google purchases are discretionary. Much of the warrant may never vest. Full vesting would validate unusually large custom-chip demand but could dilute existing holders. Sources: Marvell 8-K, Marvell 10-Q, Reuters, StockAnalysis.