
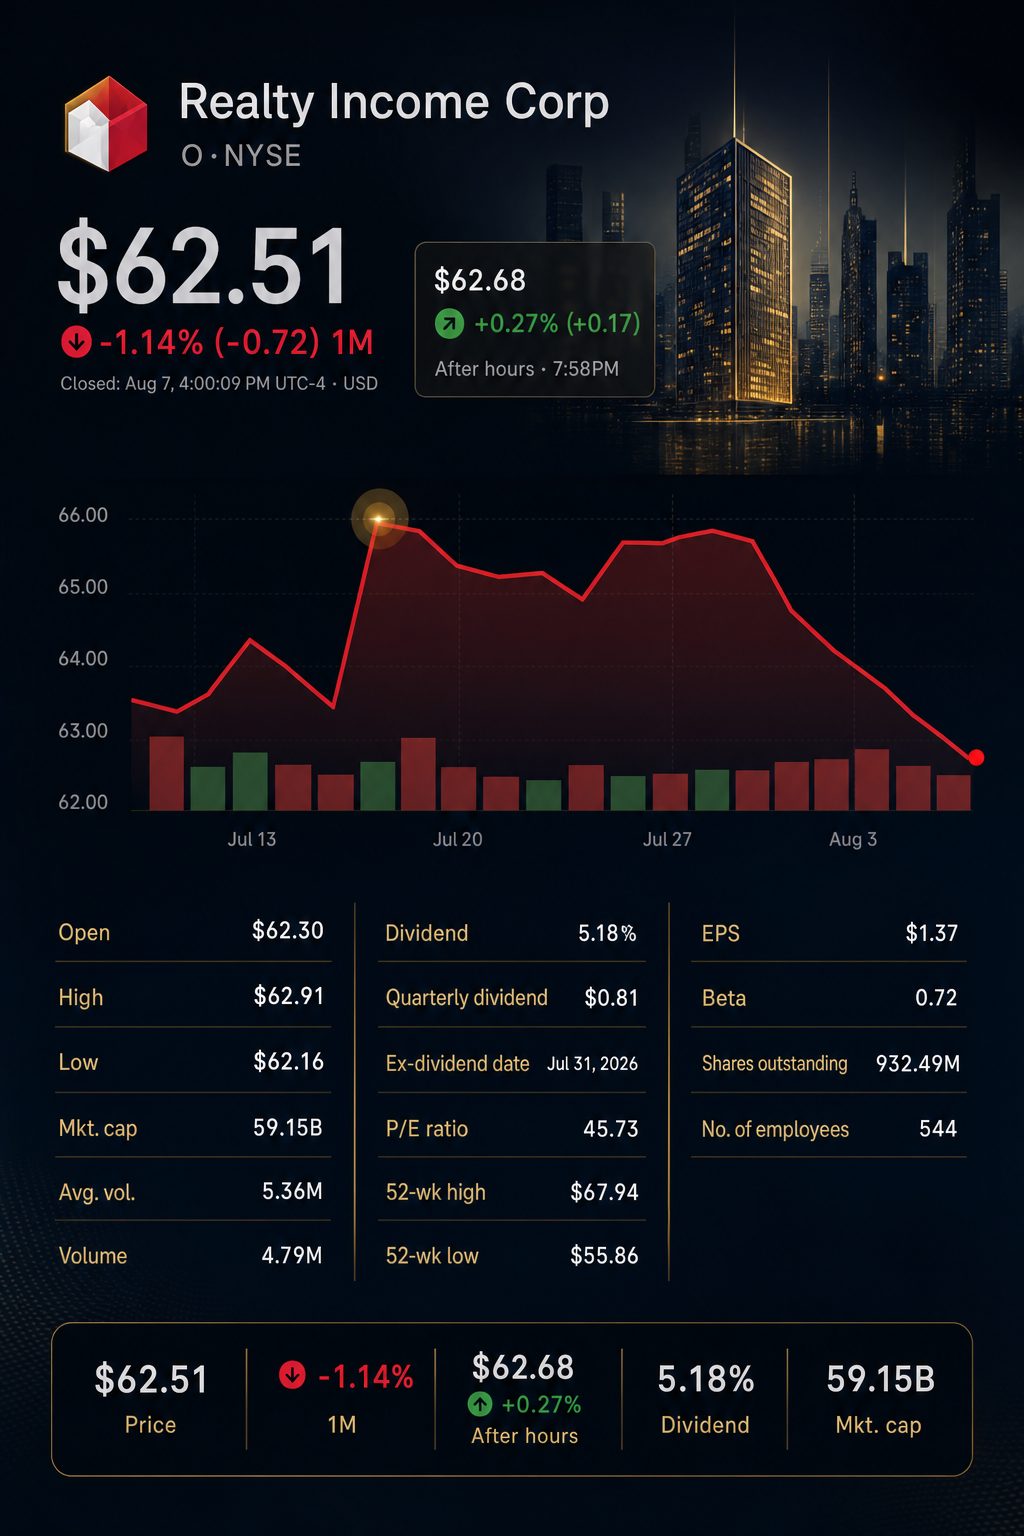
NEW YORK, August 8, 2026, 16:05 EDT — Trading has ended in U.S. markets.
- Realty Income Corporation NYSE:O closed Friday at $62.51, slipping 2.1% over the week.
- The updated 2026 AFFO outlook suggests a 7.11% yield, while total investments in Q2 produced a 7.3% yield.
- The company reported that private-capital sources accounted for 73% of equity capital so far this year.
Realty Income closed Friday at $62.51, falling 2.1% over the week. The stock lost an early post-earnings advance.
Based on Friday’s price, updated 2026 AFFO guidance points to a yield of 7.11%. Total investments in Q2 delivered an initial cash yield of 7.3%. The difference of 19 basis points between the two is minimal.
The comparison uses a straightforward screening method rather than a comprehensive cost-of-capital assessment. It does not take into account leverage, fees, currency movements or overhead. Conventional real estate acquisitions in Q2 generated a yield of only 6.4%.
This provides context for management’s focus on private capital. Realty Income reported that 73% of equity capital raised year-to-date originated from private investors. The gap between total and pro-rata investment in Q2 stood at $493.1 million, representing 19.2%.
Capital markets at Friday’s session end
| Metric | Value | Simple comparison |
|---|---|---|
| Friday share price | $62.51 | At market close |
| Revised 2026 AFFO midpoint | $4.445 | Guidance from company |
| Implied AFFO yield | 7.11% | Derived figure |
| Q2 real-estate acquisition yield | 6.40% | 71 bps under AFFO yield |
| Q2 development yield | 7.60% | 49 bps higher than AFFO yield |
| Q2 other-investment yield | 9.20% | 209 bps higher than AFFO yield |
| Q2 total investment yield | 7.30% | 19 bps above AFFO yield |
The market’s first response was upbeat. The stock started trading Thursday at $64.335, reaching a high of $64.95 before ending the day at $62.36. By Friday’s close, shares had settled 0.3% under Wednesday’s closing price before the news.
The reversal indicates that guidance by itself did not secure a higher valuation. Still, Realty Income surpassed three major net-lease peers on Friday.
Friday’s net-lease sector comparison
| Company | Close | Friday move | Market value |
|---|---|---|---|
| Realty Income Corporation NYSE:O | $62.51 | up 0.24% | $58.43 billion |
| NNN REIT, Inc. (NYSE:NNN) | $46.84 | down 0.34% | $8.88 billion |
| Agree Realty Corporation (NYSE:ADC) | $75.63 | down 0.94% | $9.11 billion |
| W. P. Carey Inc. (NYSE:WPC) | $71.81 | down 0.08% | $16.32 billion |
Investors received a boost from operating performance. Revenue climbed 9.7%, and AFFO per share was up 3.8%. Occupancy improved to 98.8%, an increase of 20 basis points compared with the previous year.
Operating results for the second quarter
| Metric | Q2 2026 | Q2 2025 | Change |
|---|---|---|---|
| Revenue | $1.5477 billion | $1.4104 billion | +9.7% |
| Net income to common holders | $344.0 million | $196.9 million | +74.7% |
| FFO per share | $1.07 | $1.06 | +0.9% |
| AFFO per share | $1.09 | $1.05 | +3.8% |
| Dividends paid per share | $0.812 | $0.806 | +0.7% |
| Portfolio occupancy | 98.8% | 98.6% | up 20 bps |
FFO and AFFO are non-GAAP metrics determined by the company. Realty Income further noted that net income comparisons may be affected by impairments and gains from property sales.
Chief Executive Sumit Roy stated the results demonstrated “the strength of Realty Income’s diversified platform and our disciplined approach to capital allocation.” Realty Income
Management increased its 2026 investment goal by 5.3% to $10.0 billion. The midpoint for AFFO rose just 0.45% to $4.445. As a result, where capital comes from is now more critical than overall headline amount. The outlook numbers are company projections.
Wall Street remained wary following the report. According to Google Finance, there are five Buy recommendations, 10 Hold ratings, and one Sell. The average price target is $67.55, suggesting an 8.1% gain from the close on Friday.
Recent analyst ratings
| Analyst | Firm | Date | Recommendation | Target |
|---|---|---|---|---|
| Brad Heffern | RBC Capital Markets — Royal Bank of Canada NYSE:RY | Aug. 7 | Buy, reaffirmed | $70.00 |
| Jeffrey Spector | BofA Securities — Bank of America Corporation NYSE:BAC | Aug. 7 | Hold, reaffirmed | $72.00 |
| Simon Yarmak | Stifel Nicolaus — Stifel Financial Corp. NYSE:SF | Aug. 6 | Buy, restated | $70.75 |
| James Kammert | Evercore ISI — Evercore Inc. NYSE:EVR | Aug. 6 | Hold, restated | $67.00 |
| Ronald Kamdem | Morgan Stanley NYSE:MS | Aug. 6 | Hold, restated | $67.00 |
Income remains rate-sensitive. Realty Income offers a $3.252 annualized dividend, producing a 5.20% yield at Friday’s close. This is just 55 basis points higher than the 10-year Treasury yield at 4.65%.
Shareholders on record as of July 31 will receive a payment of $0.271 per share on August 14.
Key macroeconomic events are in focus next week. Inflation figures may influence long-term yields, while retail sales will provide insight into the consumer environment for numerous tenants.
Looking ahead: Calendar for the week
| Date and time, ET | Event | Investor relevance |
|---|---|---|
| Aug. 12, 08:30 | July consumer prices | Impact on long-term yields and REIT prices |
| Aug. 13, 08:30 | July producer prices | Effect on inflation outlook and borrowing costs |
| Aug. 14, 08:30 | July retail sales | Insights on consumer spending and tenant performance |
| Aug. 14 | $0.271 Realty Income dividend payment | Payout to shareholders as of July 31 |
Risks: Rising Treasury yields may narrow the stock’s multiple and its dividend differential. Private vehicles introduce execution risk and depend on fee projections. Fluctuations in tenant credit, currency volatility, and major joint ventures could also negatively impact projected returns.
The investor focus extends beyond deal flow. Realty Income is now expected to transform private capital into per-share gains, even as returns on public equity stay limited.
Related articles: NYSE:O