
SEATTLE, August 11, 2026, 12:44 EDT
- Amazon stock declined 2.3% to $271.57, bringing its market capitalization down to $2.93 trillion.
- Around 60% of operating income in the second quarter came from AWS.
- Trailing free cash flow shifted to an outflow of $7.6 billion.
Shares of Amazon.com, Inc. NASDAQ:AMZN dropped 2.3% on Tuesday, reducing the company’s market capitalisation to $2.93 trillion. The decline followed a short-lived move above the $3 trillion threshold.
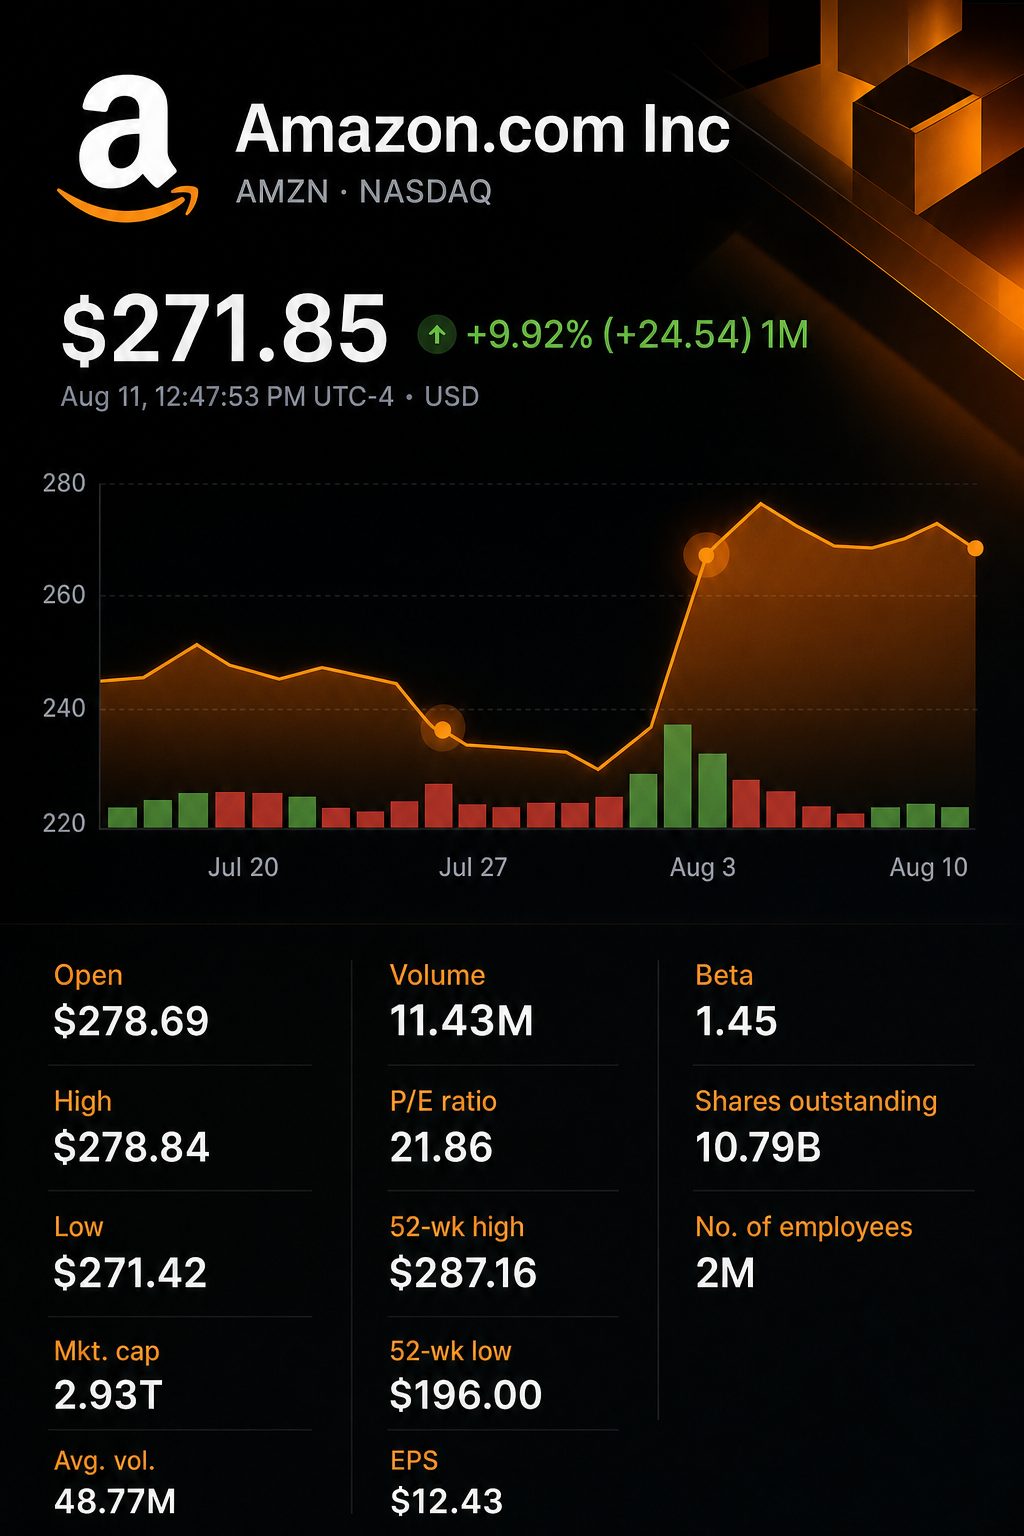
The price change intensifies Amazon’s key test for investors. AWS is seeing faster growth, while the infrastructure bill has caused trailing free cash flow to dip into negative territory.
The division is notably distinct. AWS accounted for around 60% of operating income for the quarter, despite making up 21% of total sales.
| Amazon market snapshot | August 11 reading | Comparison |
|---|---|---|
| Share price | $271.57 | Off 2.34% |
| Intraday range | $271.42-$278.84 | Session began at $278.69 |
| Market value | $2.93 trillion | Short of $3 trillion threshold |
| Volume by 12:31 EDT | 10.80 million | Typical volume 48.77 million |
| 52-week range | $196.00-$287.16 | Shares 5.4% under peak |
The stock reached a low of $271.42, having opened at $278.69. Amazon remains 38.6% higher than its 52-week low.
Analysts continue to express strong optimism. DBS reiterated its Buy rating on Tuesday with a price target of $332. On Monday, Goldman Sachs also reiterated Buy, assigning a $375 target.
| Analyst or measure | Rating | Target | Upside/downside |
|---|---|---|---|
| DBS, August 11 | Buy | $332 | +22.3% |
| Goldman Sachs, August 10 | Buy | $375 | +38.1% |
| D.A. Davidson, July 31 | Hold | $250 | -7.9% |
| Average among 39 analysts | 38 Buy / 1 Hold / 0 Sell | $333.31 | +22.7% |
| Range from high to low | Not applicable | $250-$400 | -7.9% to +47.3% |
The average price target stands at $333.31, representing a 22.7% gain from the most recent price. However, the $150 gap between the highest and lowest forecasts highlights continued uncertainty over long-term AI returns.
Bullish sentiment is backed by second-quarter results. Sales increased by 20%, with operating income up 43%.
| Second-quarter measure | 2026 | 2025 | Change |
|---|---|---|---|
| Net sales | $200.6 billion | $167.7 billion | up 20% |
| Operating income | $27.5 billion | $19.2 billion | up 43% |
| Net income | $62.6 billion | $18.2 billion | up 244% |
| Diluted EPS | $5.75 | $1.68 | up 242% |
The company’s net income reflected $53.4 billion in pre-tax non-operating gains, largely attributed to its investment in Anthropic. Operating metrics present a clearer picture of ongoing business performance.
AWS drove profits, posting a 37% increase in sales, the highest growth rate in 18 quarters.
| Amazon segment | Q2 sales | Sales growth | Operating income | Implied margin |
|---|---|---|---|---|
| North America | $116.2 billion | +16% | $9.1 billion | 7.8% |
| International | $42.2 billion | +15% | $1.7 billion | 4.0% |
| AWS | $42.2 billion | +37% | $16.6 billion | 39.3% |
AWS generated the same revenue as the International unit but recorded operating profit nearly tenfold higher. Its margin stood at 39.3%, compared to 7.8% in North America.
Chief Executive Andy Jassy stated, “AWS is booming, growing 36.7% year-over-year in Q2—our fastest growth in 18 quarters—and our AI and Chips businesses each eclipsed run rates of more than $25 billion.” Amazon
The outlook for cash flow is more complex. Operating cash flow increased, yet capital expenditures grew at a significantly higher pace.
| Trailing 12-month cash measure | June 2026 | June 2025 | Change |
|---|---|---|---|
| Operating cash flow | $161.4 billion | $121.1 billion | up 33% |
| Property and equipment purchases | $173.0 billion | $107.7 billion | up 61% |
| Free cash flow | -$7.6 billion | $18.2 billion | down $25.8 billion |
Amazon attributed the drop in free cash primarily to investment in AI. Purchases of property and equipment totaled $173.0 billion in the past 12 months, an increase of around $65.4 billion.
Risks: Fluctuations in energy costs, memory-chip availability, tariffs, and customer demand can rapidly impact expenses. The main risk concerns timing, as spending on data centers happens ahead of related cloud sales, potentially keeping free cash flow unpredictable.
Amazon projects third-quarter revenue in the range of $197 billion to $202 billion, with operating profit expected between $22.5 billion and $26.5 billion. The next key metric for valuation is whether AWS can maintain approximately 37% growth as free cash flow shows early signs of recovery.
Related articles: NASDAQ:AMZN