Investor Dashboard

Amazon.com rose roughly 4% on Friday following an analyst upgrade that emphasized the possibilities for agentic AI to enhance retail operations. Shares were around $266.43 as of 04:37 EDT Monday.
Category hubCloud Computing
Follow the latest TechStock² reporting, investor analysis and material developments for Cloud Computing in one continuously updated topic hub.
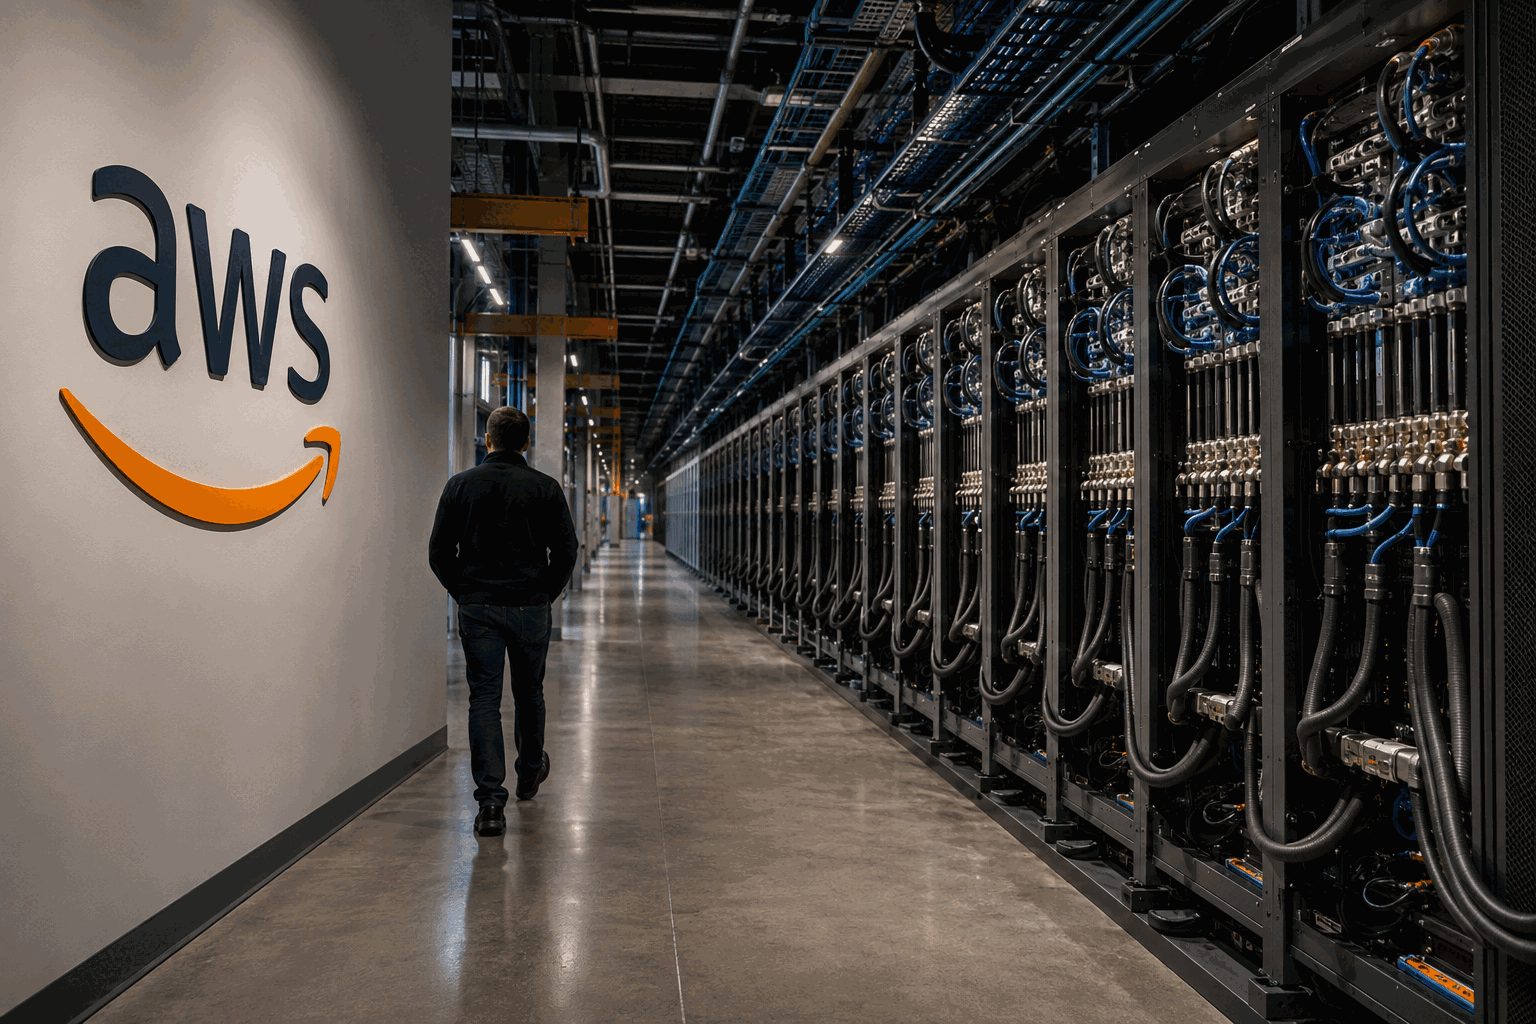
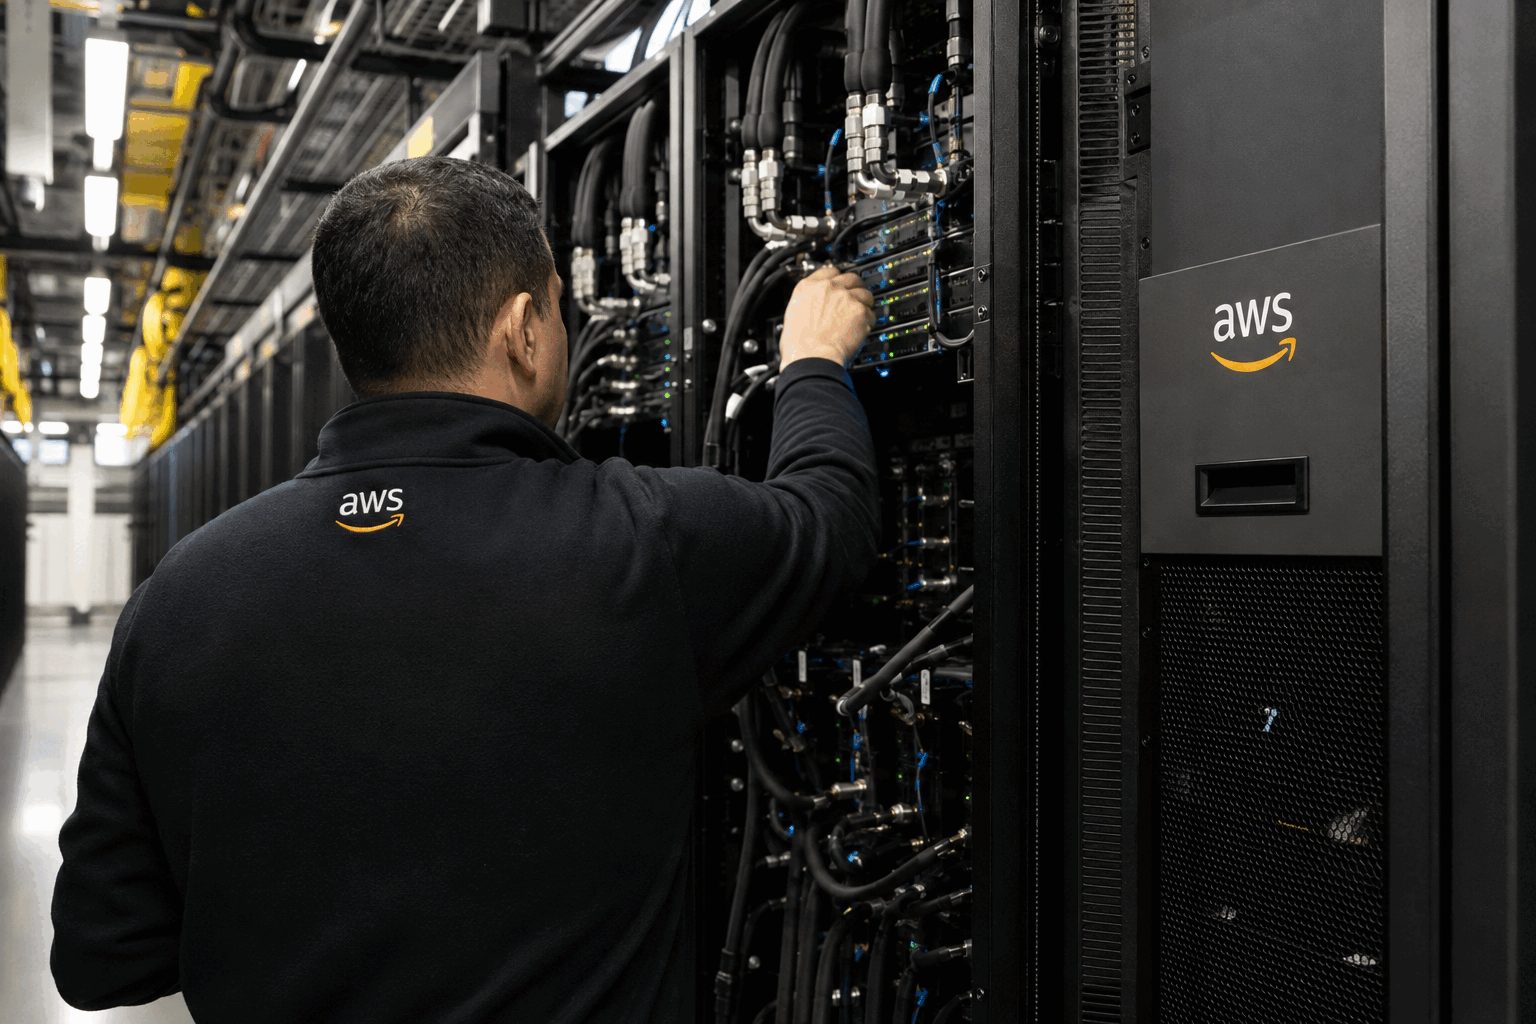
AWS generated 60% of group operating profit from 21% of sales.
| Group sales | $200.6B |
| Operating income | $27.5B |
| AWS sales | $42.2B |
| AWS operating income | $16.6B |
| AWS operating margin | 39.3% |
| Advertising growth | 26% |
| Measure | Current TTM | Prior TTM |
|---|---|---|
| Operating cash flow | $161.4B | $121.1B |
| Free cash flow | −$7.6B | $18.2B |
| P&E purchase increase | +$66.1B year over year | |
| Implied annualized Q2 operating profit | $110.0B | |
| Market value / annualized operating profit | ~26× | |
Core test: keep AWS near 37% growth without making negative free cash flow structural.
Sources: Amazon Q2 2026 results; current market quotes; public reporting on the AWS–NVIDIA expansion. Estimates may differ from reported GAAP measures.
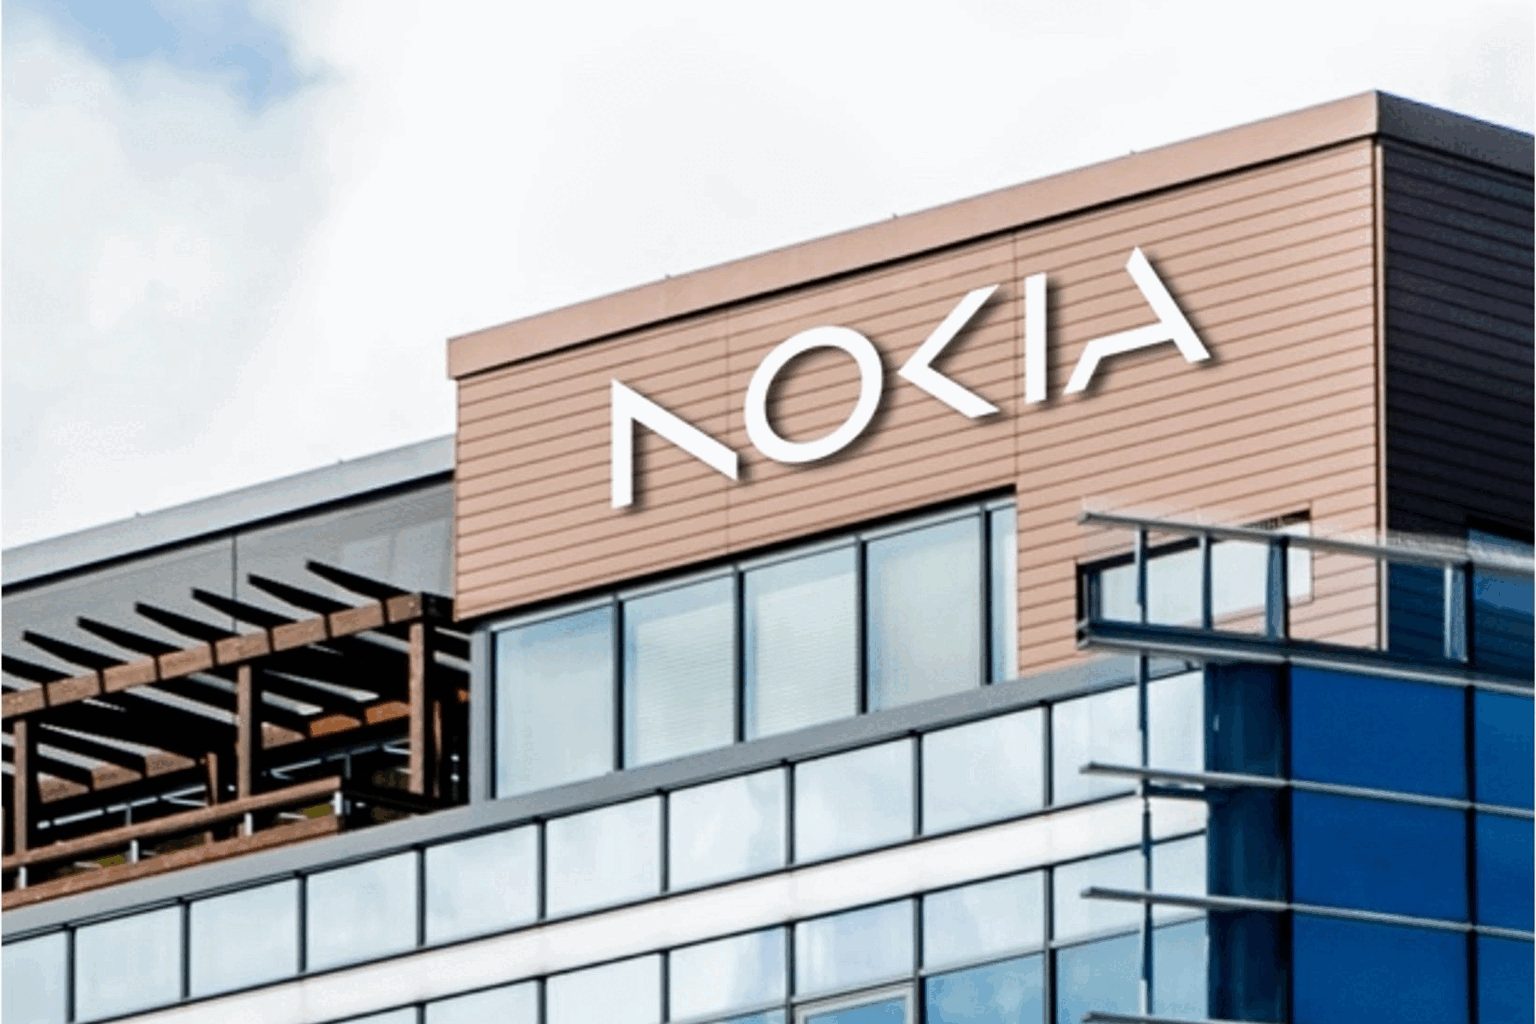
The reported-margin marker sits below zero; restructuring created a 10-point gap versus the comparable measure.
| Metric | Value | Change |
|---|---|---|
| Net sales | €4.82B | +8% |
| AI & Cloud sales | €446M | +105% CC |
| AI & Cloud orders | ~€2.8B | Pipeline |
| Comparable operating profit | €434M | 9.0% margin |
| Reported operating result | −€50M | −1.0% margin |
| Restructuring charges | €390M | Cash burden |
| 2026 comparable operating profit | €2.1B–€2.6B |
| Management target | Somewhat above midpoint |
| Net cash + interest-bearing investments | €2.78B |
| Working-capital outflow | ~€1.15B |
| Trailing P/E screen | ~72× |
| Communications-industry average | ~34× |
Core test: AI revenue can support a rerating only if operating gains reach free cash flow.
Sources: Nokia Q2 and half-year 2026 report; MarketWatch price and volume; published valuation screen. Constant-currency growth is marked “CC.”
Fiscal Q1 2027 results and premarket repricing
| Operating measure | Reported | Investor read-through |
|---|---|---|
| Adjusted EPS | $0.70 vs $0.58 consensus | Beat supports the rally |
| Q2 revenue midpoint | $486.5M vs $483M consensus | Modest upside to expectations |
| >$100K ACV customers | 1,800 vs 1,550 year ago | Enterprise cohort grew 16% |
| Non-GAAP operating margin | 16.2% | Positive adjusted leverage |
| GAAP operating margin | -5.0% | Profit-quality gap remains |
Current RPO grew six points faster than revenue. That expands near-term contracted visibility if deployments and renewals convert as planned.
A slower backlog conversion, rising AI infrastructure costs or stronger cloud competition could expose the gap between adjusted profit and the GAAP loss.
Sources: Elastic fiscal Q1 2027 release; FactSet estimates cited by Investors.com; StockAnalysis premarket quote. Market figures timestamped 28 Aug 2026, 08:03 EDT. Implied value change is an estimate, not a reported company figure.
FY2026 results and premarket reset · Market data at 07:14 EDT, August 28, 2026
ARR is a non-GAAP operating metric. IREN warns recognized revenue may be materially lower. Commissioning and customer acceptance govern conversion.
| US$ millions | Q4 | Q3 | Change |
|---|---|---|---|
| Total revenue | 137.2 | 144.8 | −5.2% |
| AI Cloud | 70.5 | 33.6 | +109.8% |
| Bitcoin mining | 66.7 | 111.2 | −40.0% |
| Adjusted EBITDA | 19.2 | 59.5 | −67.7% |
| Net loss | (684.0) | (247.8) | Wider |
Quarter-end cash and restricted cash: $7.62B.
Q4 operating cash flow: $1.81B, including a $1.72B increase in deferred revenue.
Deferred revenue supports cash flow before revenue recognition. It also creates delivery obligations.
The market is weighing a fast mix shift against its accounting cost. AI Cloud more than doubled sequentially, but adjusted EBITDA fell 68% and the quarter carried a $450.4M mining-hardware impairment.
The key question is no longer demand alone. It is how quickly contracted ARR becomes recognized revenue without further impairments, delays or financing strain.
52-week range
$25.31–$76.87
Short interest
30.61% of float
Three-month return
−36.21%
One-year return
+53.06%
| 2026 IT capacity target | 0.3 GW |
| 2027 IT capacity target | 0.8 GW |
| Horizon 1 | Accepted by Microsoft |
| Recent contract economics | >$20M revenue/MW |
| Claimed payback | ~2 years |
Commissioning delaysCustomer concentrationGPU supplyHardware obsolescenceDebt costBitcoin exposure
The $4B contracted ARR figure is not recognized revenue. Timing, utilization, uptime and customer acceptance remain decisive.
Sources: IREN FY2026 results; MarketWatch quote and ownership data; Investors.com market report. Financial figures in U.S. dollars. Calculations may differ due to rounding.
AI monetization accelerates; valuation catches up quickly.
| Metric | Value | Growth |
|---|---|---|
| Revenue | $11.35B | +11% |
| cRPO | $33.5B | +14% |
| Agentforce + Data 360 ARR | ≈$3.9B | >+210% |
| Free cash flow | $1.1B | +81% |
| GAAP operating margin | 20.5% | — |
Updated FY2027 revenue range: $46.1B–$46.4B. Contentful and Fin remain pending.
| Rating | Count | Share |
|---|---|---|
| Buy | 29 | |
| Hold | 9 | |
| Sell | 1 |
39 analysts; targets range from $160 to $400. Data viewed Aug. 28, 2026.
| Signal | Bull case | Risk case |
|---|---|---|
| AI monetization | ARR sustains triple-digit growth | Usage fails to lift core growth |
| Guidance quality | Organic raise expands | Acquisitions carry the increase |
| Valuation | Targets move higher | Close already nears consensus |
| Margins | Cash growth stays ahead of sales | Integration costs pressure leverage |
Sources: Salesforce Q2 FY2027 release; Public/Xignite closing data; Google Finance analyst data; Reuters. Prices as of Aug. 27 close. Not investment advice.
| Metric | Q2 FY27 | Year earlier | Change |
|---|---|---|---|
| Revenue | $11.345B | $10.236B | +10.8% |
| Current RPO | $33.5B | ≈$29.4B | +14% |
| Free cash flow | $1.098B | $0.605B | +81% |
| GAAP operating margin | 20.5% | 22.8% | −230 bp |
| Diluted share count | 821M | 962M | −14.7% |
| Revenue | $46.1B–$46.4B |
| Revenue growth | 11%–12% |
| Non-GAAP margin | 34.3% |
| Free-cash-flow growth | 4%–5% |
| Non-GAAP EPS | $16.67–$16.71 |
The target implies about 6% upside from $228.63. Premarket trading has already captured most of the pre-result consensus gap.
Now: Earnings beat, 14% cRPO growth and nearly $3.9B of AI-and-data ARR.
Next: Contentful and Fin closings, Q3 cRPO delivery and October ASR settlement.
Acquisitions contribute $200M of the $200M reported guidance raise; organic growth contributes $100M while FX subtracts $100M.
GAAP margin fell 230 basis points. Strategic investments supplied $2.53 of adjusted Q2 EPS.
Market data: August 25, 2026, 4:00 p.m. EDT
After-hours: 7:59 p.m. EDT • Dashboard: August 26, 2026, 01:10 EDT
+21.81% • +$0.53
−1.68% from close
7.7× 12.9M 3-month average
≈$211M added Tuesday
The close remains 65.0% below the 52-week high despite Tuesday’s surge.
Rezolve says its database provides indexing and pipelines behind Google Cloud Web3 datasets.
Preliminary H1 covers 35.3% of guidance. H2 must run about 83% above H1.
| Measure | Numerator | Denominator | Multiple |
|---|---|---|---|
| Market cap / FY 2025 revenue | $1.18B | $46.8M | 25.2× |
| Market cap / FY 2026 guidance | $1.18B | $360M | 3.3× |
| Tuesday value gain / FY26 guide | ≈$211M | $360M | 0.59× |
| Analyst target / close | $10.50 avg. | $2.96 | 3.55× |
Five-analyst consensus: Strong Buy; target range $7–$15. Targets predate this catalyst.
Investor read: Google validates the technology, but September must validate economics. Watch recognized revenue, gross margin, cash conversion, outstanding shares and continued support for the $360 million outlook.
Sources: Rezolve AI investor releases dated July 27, August 6 and August 25, 2026; Rezolve AI 2025 Form 20-F; S&P Global Market Intelligence and Nasdaq UTP data displayed by StockAnalysis. Derived figures may differ due to rounding.
Market snapshot: August 25, 2026, 13:12 EDT · U.S. regular session. Partnership announced August 25, 2026.
Commercial terms, minimum usage and contract duration were not disclosed. The value lies in workload access; monetization still requires consumption.
$104B backlog compared with $48.67B equity value. Backlog converts only as capacity becomes available and services are delivered.
| Metric | Q2 2026 | YoY / margin |
|---|---|---|
| Revenue | $2.575B | +112% |
| Adjusted EBITDA | $1.510B | 59% margin |
| Operating loss | $49M | -2% margin |
| Net loss | $626M | -24% margin |
| Interest expense | $640M | 24.9% of revenue |
| Property purchases | $6.422B | 2.49× revenue |
June 30, 2026. Debt is the sum of current and long-term recourse and non-recourse balances.
| Firm / set | Date | Rating | Target | Upside / downside |
|---|---|---|---|---|
| 38-analyst consensus | Aug. 25 | Buy | $144.17 | +63% |
| Truist | Aug. 19 | Buy | $155 | +76% |
| Goldman Sachs | Aug. 20 | Hold | $139 | +58% |
| Barclays | Aug. 13 | Hold | $105 | +19% |
| Bernstein | Aug. 12 | Sell | $74 | -16% |
Rescale adds a distribution layer for compute-heavy engineering. CoreWeave can diversify workload types while reusing the same GPU, networking and storage stack. Revenue growth above 100% and a backlog twice the equity value create substantial operating leverage if utilization rises.
No commercial value was disclosed. Debt is more than six times cash, interest consumed nearly one quarter of quarterly revenue, and property purchases were 2.5 times revenue. Slow deployments or weak utilization can make new demand expensive to serve.
Sources: CoreWeave–Rescale announcement; CoreWeave Q2 results; StockAnalysis market data; analyst consensus. Figures timestamped as shown; calculations by TS2.
Rezolve AI’s first major distributed-database deployment passed Google’s technical review. The market added about $209 million in equity value before either side disclosed contract revenue.
Technical scope: detailed. Contract economics: absent.
| Measure | Period | Reading |
|---|---|---|
| Revenue | FY 2025 | $46.8M audited |
| Gross margin | FY 2025 | 66% audited |
| Net loss | FY 2025 | $(101.4)M |
| Operating cash flow | FY 2025 | $(63.1)M |
| Cash | Dec. 31, 2025 | $111.1M |
| Revenue | H1 2026 | ≈$127M preliminary |
| Revenue guidance | FY 2026 | ≈$360M |
The gain equals roughly 4.5× audited FY 2025 revenue. It does not represent disclosed contract revenue.
Consensus collected August 25, 2026; underlying ratings span the prior 12 months.
What is the contract value? When does revenue recognition begin? Which costs support the deployment? Can the platform expand beyond 10 networks without lowering margins?
No fees, minimum commitment or revenue timing disclosed.
Preliminary H1 revenue remains unaudited until the September release.
The 2025 Form 20-F reported losses, cash burn and a going-concern warning.
Market snapshot: August 21, 2026, 11:14 EDT
US market open · CNY financial data
| Metric | Latest | YoY | Signal |
|---|---|---|---|
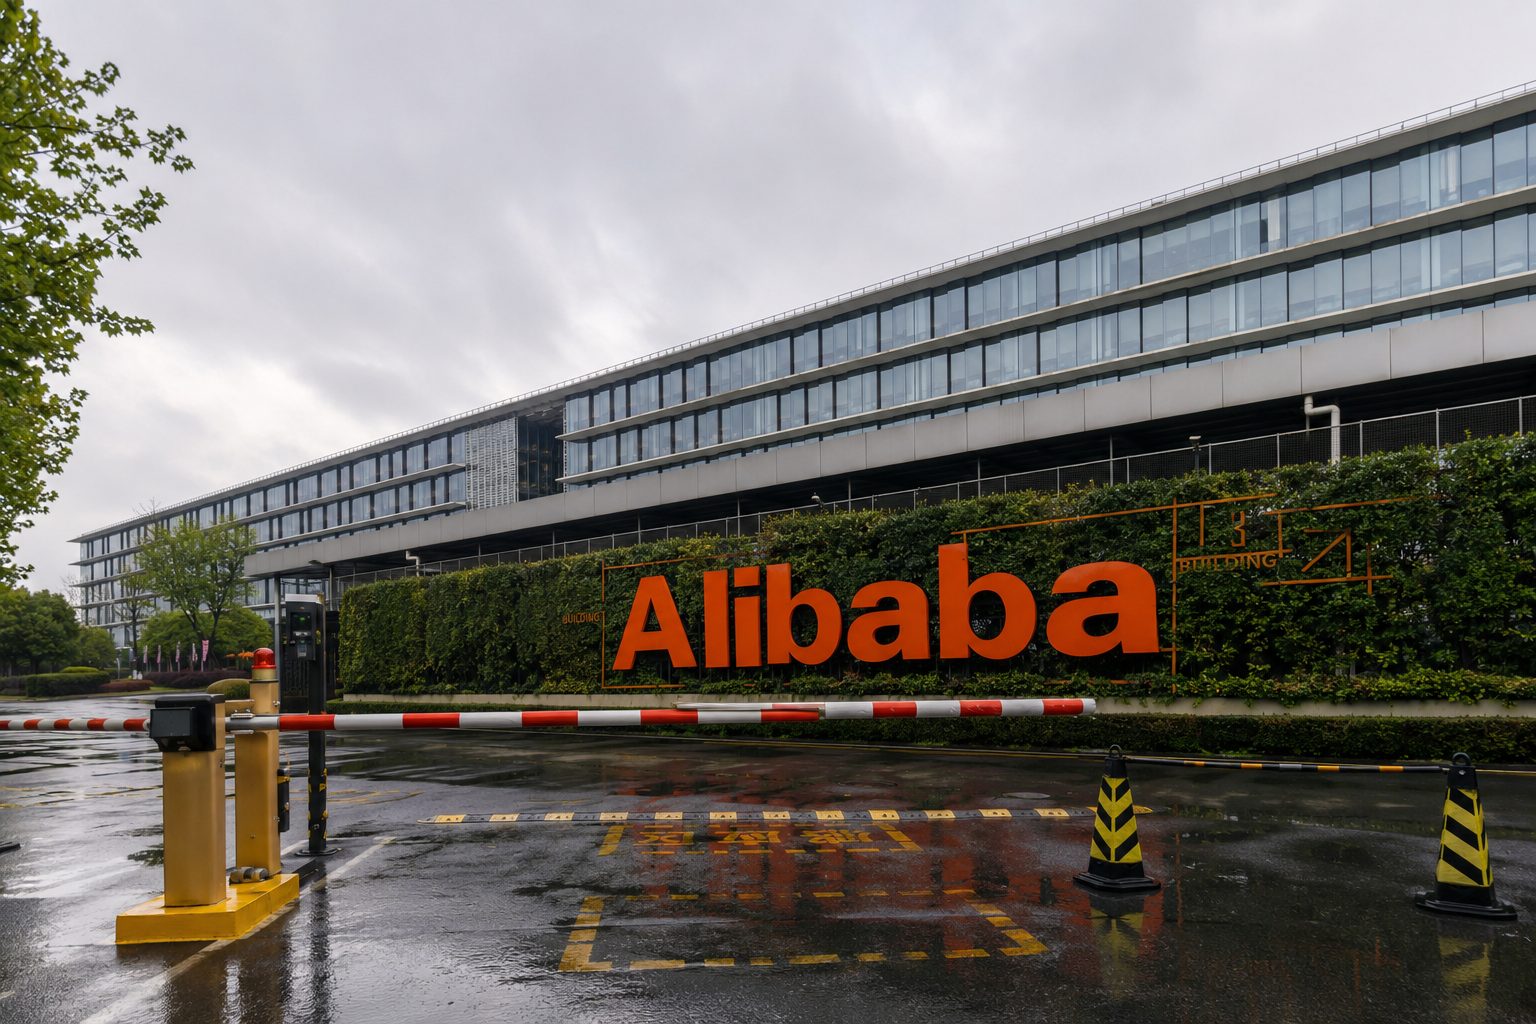
| Group revenue | RMB268.95bn | +9% | Top line held |
| Operating income | RMB15.16bn | −57% | Investment drag |
| Net income | RMB10.44bn | −75% | Sharp contraction |
| Operating margin | 6% | −8 pts | Group leverage weakened |
| Cloud EBITA margin | 12% | Expanded | Unit economics improving |
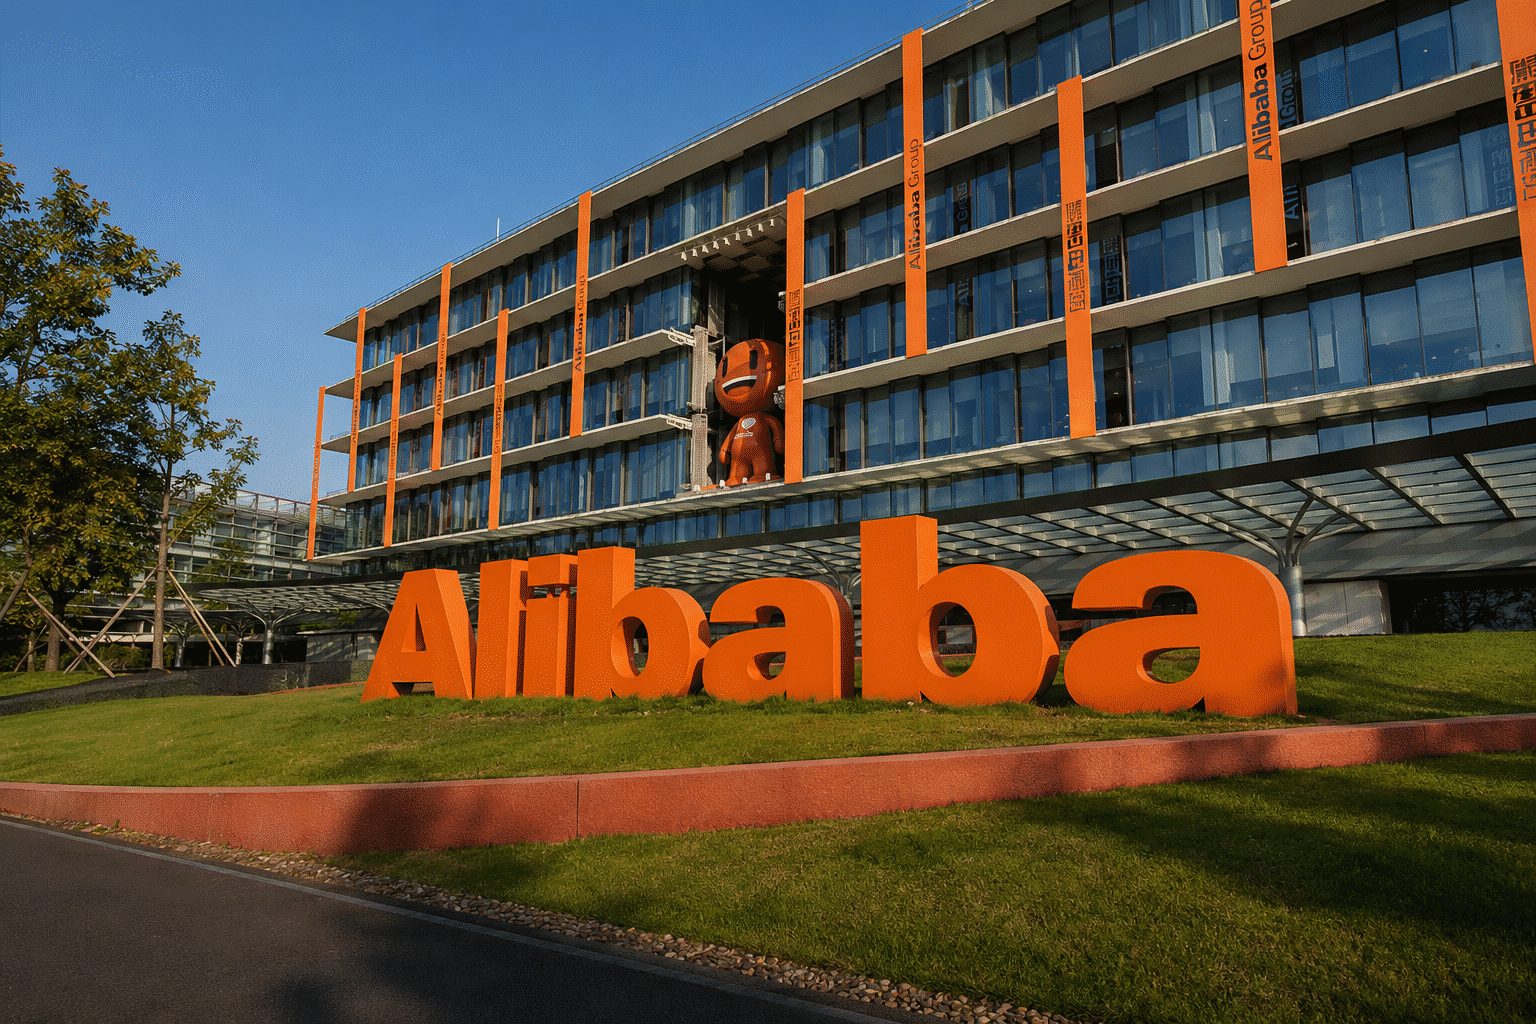
Sources: Alibaba June-quarter release; Reuters, August 20, 2026; StockAnalysis/S&P Global and CBOE. Market-value loss uses 2.28 billion shares and the $9.14 intraday decline. Cloud prior-period revenue and related ratios are preliminary estimates derived from reported growth.
June-quarter 2026 results · Figures in renminbi unless noted
August 20, 2026, 18:59 EDT
AI Labs and Applications lost 2.46 times the RMB5.63 billion adjusted EBITA earned by AI Cloud. Infrastructure monetisation is real. Model and app spending still overwhelms it.
Bar lengths emphasize relative investor relevance and are not drawn to one common revenue scale.
RMB67.68bn capex equalled 17.8% of the three-year RMB380bn AI/cloud commitment in one quarter.
At $130.20, the $190.01 consensus target implied about 46% upside. Targets are opinions, not forecasts of certain returns.
Adjusted EBITA margin reached about 12%, up from roughly 7%. Sustained gains would validate the infrastructure build-out.
The RMB13.86bn quarterly loss widened 330%. A flatter cost curve is needed before AI profit reaches group earnings.
Capex rose 75%, while free cash flow stayed deeply negative. Watch procurement, proprietary-chip deployment and buybacks.
Sources: Alibaba June-quarter 2026 results, Reuters, August 20, 2026, and S&P Global analyst data displayed by StockAnalysis. Market data are after-hours and may differ from the next official session.
June quarter 2026 · reported August 20, 2026
Cloud growth accelerated, but capex grew 30 points faster. Listen for utilization, cloud margins, capex timing and any update to Alibaba’s three-year AI budget.
| Company | Revenue | AI / cloud | Initial reaction |
|---|---|---|---|
| Alibaba (BABA) | +9% | +45% | about −4% premarket |
| Baidu (BIDU) | −4% | AI Core +25% | about −7% |
| JD.com (JD) | about −3% | Not comparable | −7% U.S. |