
NEW YORK, August 19, 2026, 16:13 EDT — U.S. markets closed.
- CrowdStrike fell 5.3% to $201.58, the weakest move among four major cyber stocks.
- Options imply about a 10% earnings move; a 30% drop would reach roughly $141.11.
- The next earnings report is August 26, correcting claims that Wednesday’s fall followed results.
CrowdStrike Holdings NASDAQ:CRWD dropped 5.3% on Wednesday, closing at $201.58. The decline erased about $2.9 billion of market value and outpaced key cybersecurity peers.
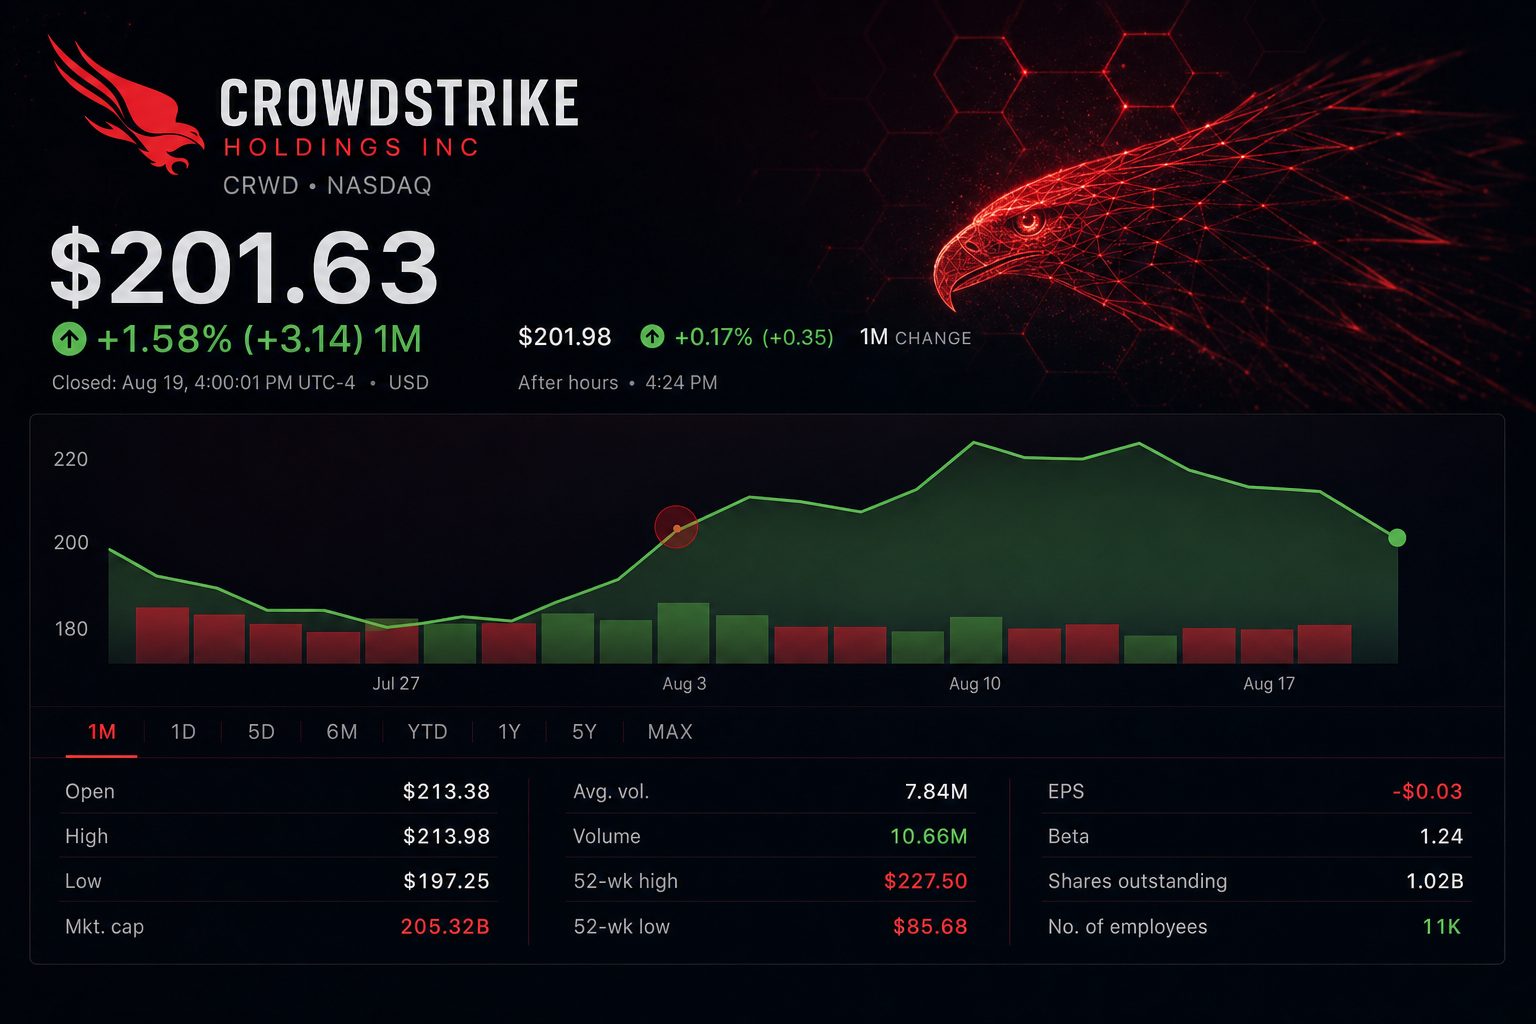
The timing matters. CrowdStrike has not reported its latest quarter. Fiscal second-quarter results are due after the close on August 26, according to the company’s official earnings notice.
That makes Wednesday’s move a pre-earnings valuation reset, not a post-results verdict. The distinction also reframes a widely circulated 30% downside thesis as a scenario rather than fresh company news.
| Cybersecurity stock | Aug. 19 close | Daily move | Market value |
|---|---|---|---|
| CrowdStrike NASDAQ:CRWD | $201.58 | -5.3% | $52.0 billion |
| Palo Alto Networks NASDAQ:PANW | $359.81 | -3.8% | $288.2 billion |
| Fortinet NASDAQ:FTNT | $152.85 | -3.3% | $113.1 billion |
| Zscaler NASDAQ:ZS | $184.59 | -0.6% | $29.7 billion |
CrowdStrike traded 9.29 million shares. That remained below the recent 50-day average of roughly 10.3 million, suggesting de-risking rather than capitulation. The official price history shows Tuesday’s close at $212.92.
The options market offers a useful scale. Traders price an earnings move near 10%, while one short put structure used a $177.60 break-even. That level sits 11.9% below Wednesday’s close.
| Post-earnings scenario | Implied price | Move from $201.58 | Interpretation |
|---|---|---|---|
| Options upside | $221.74 | +10% | Near recent highs |
| Options downside | $181.42 | -10% | Normal implied range |
| Put break-even cited | $177.60 | -11.9% | Below implied downside |
| 30% bear case | $141.11 | -30% | Three times the implied move |
The operating base is stronger than the share move implies. First-quarter revenue rose 26% to $1.39 billion. Ending annual recurring revenue reached $5.51 billion, up 24%.
| Operating measure | Fiscal Q1 2027 | Year-over-year change | Investor test |
|---|---|---|---|
| Revenue | $1.39 billion | +26% | Can Q2 hold above 23%? |
| Ending ARR | $5.51 billion | +24% | Platform demand |
| Net new ARR | $255.8 million | +32% | Bookings momentum |
| Free cash flow | $468.5 million | +68% | Cash conversion |
| GAAP subscription margin | 78% | +1 percentage point | Hosting leverage |
Falcon Flex remains central. The model lets customers commit upfront, then draw spending across products. Flex-account ARR reached $1.69 billion at January 31, rising more than 120%.
Chief Financial Officer Burt Podbere cited a “record Q2 pipeline, continued strong retention, Falcon Flex momentum” in June. The coming report must convert that pipeline into net new ARR without weakening margins.
| Firm | Date | Rating | Price target | Upside to close |
|---|---|---|---|---|
| Truist | Aug. 19 | Buy | $245 | 21.5% |
| Benchmark | Aug. 18 | Buy | $250 | 24.0% |
| Capital One | Aug. 18 | Overweight | $242 | 20.1% |
| Barclays | Aug. 18 | Overweight | $235 | 16.6% |
| Wells Fargo | Aug. 17 | Overweight | $230 | 14.1% |
Fresh targets therefore point higher, but the broader consensus is less generous. Fifty-three analysts carry a Buy consensus and a $202.07 average target. That is almost level with Wednesday’s close.
The split explains comparisons with older targets. CrowdStrike completed a four-for-one stock split on July 2. Pre-split forecasts must be divided by four before judging today’s price.
Risks: Guidance could miss elevated expectations, Falcon Flex may pull demand forward, and litigation from the 2024 outage remains unresolved. A broad software selloff could also overwhelm company-specific execution.
The cleanest earnings test is net new ARR. A figure above $256 million would extend first-quarter momentum. A sharp slowdown would give the 30% bear case more substance than Wednesday’s volume did.
Related articles: NASDAQ:CRWD
CrowdStrike
| Metric | Value | YoY |
|---|---|---|
| Revenue | $1.39B | +26% |
| Ending ARR | $5.51B | +24% |
| Net new ARR | $255.8M | +32% |
| Free cash flow | $468.5M | +68% |
| GAAP sub margin | 78% | +1 pt |
| Firm | Date | View | Target | Upside |
|---|---|---|---|---|
| Truist | Aug. 19 | Buy | $245 | 21.5% |
| Benchmark | Aug. 18 | Buy | $250 | 24.0% |
| Capital One | Aug. 18 | Overweight | $242 | 20.1% |
| Barclays | Aug. 18 | Overweight | $235 | 16.6% |
| Signal | Bull case | Bear case |
|---|---|---|
| Net new ARR | Above Q1's $255.8M | Sharp deceleration |
| Falcon Flex | Expansion and re-flex momentum | Evidence of pulled-forward demand |
| Margins | Hosting leverage continues | AI and ingestion costs rise |
| Guidance | FY27 outlook raised | High expectations unmet |