
CrowdStrike Holdings jumped 20.5% to $227.96 on Thursday after the company reported record recurring-revenue growth and raised its annual outlook. Trading volume reached roughly 23.45 million shares.
Record net new ARR and stronger cash conversion pushed the stock near fresh highs. The valuation now leaves less room for a routine quarter.
Market close: Aug. 27, 2026, 16:00 EDT · Financials: quarter ended July 31, 2026The pre-report reference is inferred from the 20.5% one-day move. Closing data are timestamped Aug. 27, 2026, 16:00 EDT.
Net new ARR accelerated faster than total ARR. Falcon Flex ARR exceeded $2.29B and grew 101%, showing larger platform commitments rather than a narrow seat expansion.
| Revenue guide midpoint | $6.001B |
| Prior midpoint | $5.935B |
| Guide increase | $66M |
| Q3 revenue midpoint | $1.526B |
| Metric | Q2 FY27 | Change |
|---|---|---|
| Revenue | $1.471B | +26% |
| Subscription revenue | $1.400B | +27% |
| GAAP subscription margin | 78% | +1 pt |
| Operating cash flow | $530.3M | +59% |
| Free cash flow | $377.4M | +33% |
| GAAP operating loss | ($33.2M) | improved $72.3M |
Adoption rates among subscription customers as of July 31, 2026.
| Company | Ticker | Daily move |
|---|---|---|
| Okta | OKTA | +28.6% |
| CrowdStrike | CRWD | +20.5% |
| Palo Alto Networks | PANW | +12.8% |
| ServiceNow | NOW | +10.0% |
Software and security stocks also benefited from renewed AI spending confidence.
| Implied equity value | ~$238B |
| FY27 guide midpoint multiple | ~39.7× sales |
| Raised analyst targets | $238–$250 |
| Upside to target range | 4.4%–9.7% |
| Consensus | Buy · 44 analysts |
Equity value uses $227.96 and 1.044B diluted weighted-average shares. It is an approximation, not the exchange-reported market capitalization.
Valuation risk is immediate: raised price targets sit close to the market price.
Other watchpoints: long enterprise sales cycles, intense platform competition, acquisition integration, and $399.0M of quarterly stock-based compensation.
| Metric | Q2 FY27 | Q2 FY26 | Change |
|---|---|---|---|
| Revenue | $1.47B | $1.17B | +26% |
| Subscription revenue | $1.40B | $1.10B | +27% |
| Net-new ARR | $332.8M | $221.1M | +51% |
| Free cash flow | $377.4M | $283.6M | +33% |
| GAAP operating result | −$33.2M | −$105.5M | Loss narrowed 69% |
| GAAP subscription margin | 78% | 77% | +100 bp |
| Ending ARR | $6.603B–$6.612B |
| Revenue | $5.991B–$6.011B |
| Non-GAAP operating income | $1.497B–$1.508B |
| Non-GAAP EPS | $1.25–$1.26 |
| Net-new ARR growth midpoint | 34% |
The target sits only 1.8% above $206.85. Fresh post-earnings revisions may change this comparison.
Falcon Flex: More than $2.29B of ARR, or about 39% of total ending ARR.
Q3 bridge: Guidance implies about $346M of net-new ARR, roughly 4% above Q2.
The $18.0B premarket gain equals about 54 times quarterly net-new ARR and 272 times the revenue-guide midpoint increase.
GAAP operations remain loss-making. Competition, discounting and outage-related costs can pressure margins.
As of August 26, 2026, 16:40 EDT. After-hours quote; financial data covers fiscal Q2 ended July 31, 2026.
| Fiscal 2027 | Previous | Current |
|---|---|---|
| Revenue midpoint | $5.937B | $6.001B |
| Ending ARR midpoint | $6.544B | $6.607B |
| Net new ARR growth | 27.7% | 34.0% |
| Adjusted EPS | $1.21–$1.24 | $1.25–$1.26 |
The range is based on Tuesday’s close and an 8% options-implied move through week-end. It describes expected volatility, not a forecast of direction.
| Metric | Reference | Investor test |
|---|---|---|
| Revenue | $1.436B–$1.442B | Hold or beat midpoint |
| Adjusted EPS | $0.29 estimate | Post-split basis |
| ARR | $5.793B–$5.795B | Fresh bookings matter |
| Non-GAAP operating income | $345.6M–$349.1M | About 24.1% margin |
The Q2 midpoint implies roughly 11% more net new ARR than Q1. Reported balance rounding makes this calculation approximate.
| Company | Aug. 25 close | Daily move | Forward P/E | Analyst target upside |
|---|---|---|---|---|
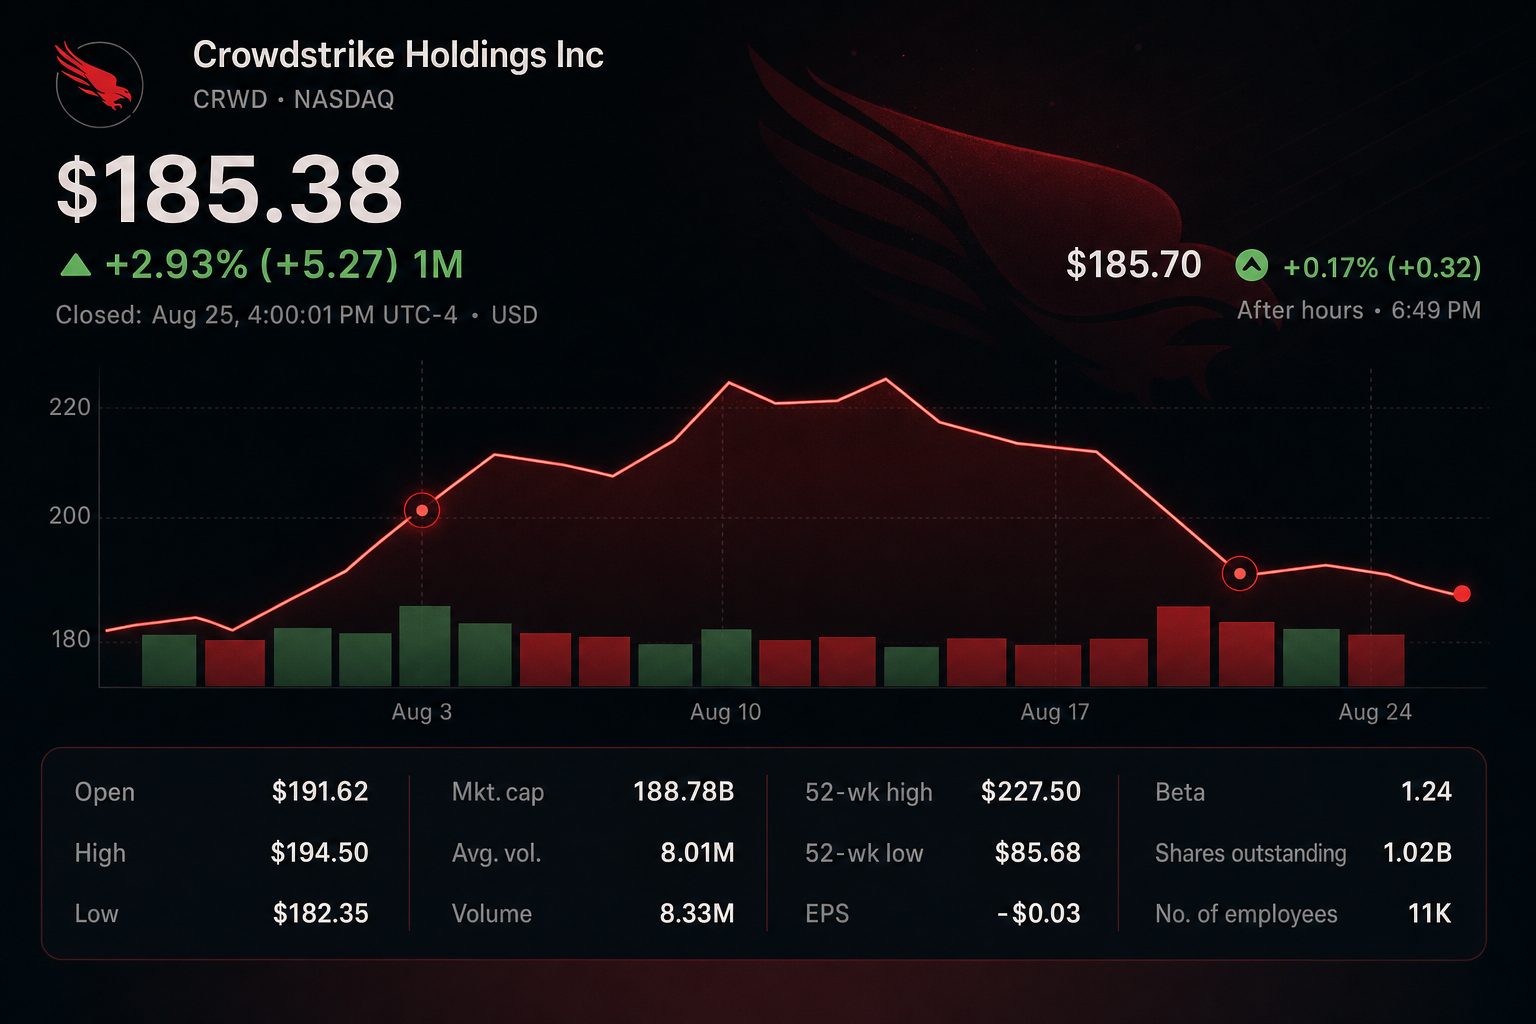
| CrowdStrike CRWD | $185.38 | −2.78% | 146.1× | +13.6% |
| Palo Alto Networks PANW | $339.90 | −3.13% | 89.6× | +6.7% |
| Zscaler ZS | $168.42 | −4.34% | 39.7× | +18.0% |
| Fortinet FTNT | $153.66 | +1.10% | 43.4× | +4.7% |
Peer weakness makes earnings-specific attribution difficult. CrowdStrike’s premium multiple raises the bar for guidance and contracted subscription growth.
The options range can overstate or understate the actual reaction. A headline revenue beat may not support the shares if ARR, net new bookings or guidance disappoint. Conversely, stronger contracted revenue and margins could outweigh a modest earnings miss. The after-hours market is also thinner than the regular session.
| Metric | Benchmark | Investor read-through |
|---|---|---|
| Revenue | $1.436B-$1.442B | Demand conversion |
| ARR | $5.793B-$5.795B | Subscription momentum |
| Non-GAAP op. income | $345.6M-$349.1M | Operating leverage |
| Split-adjusted EPS | $0.29 consensus | Profit delivery |
| Desk | Call | Target |
|---|---|---|
| Jefferies · Aug. 24 | Buy | $230 |
| Morgan Stanley · Aug. 21 | Buy | $227 |
| Baird · Aug. 21 | Hold | $220 |
| Evercore · Aug. 20 | Hold | $205 |
| Benchmark · Aug. 18 | Buy | $250 |
| Metric | Value | YoY |
|---|---|---|
| Revenue | $1.39B | +26% |
| Ending ARR | $5.51B | +24% |
| Net new ARR | $255.8M | +32% |
| Free cash flow | $468.5M | +68% |
| GAAP sub margin | 78% | +1 pt |
| Firm | Date | View | Target | Upside |
|---|---|---|---|---|
| Truist | Aug. 19 | Buy | $245 | 21.5% |
| Benchmark | Aug. 18 | Buy | $250 | 24.0% |
| Capital One | Aug. 18 | Overweight | $242 | 20.1% |
| Barclays | Aug. 18 | Overweight | $235 | 16.6% |
| Signal | Bull case | Bear case |
|---|---|---|
| Net new ARR | Above Q1's $255.8M | Sharp deceleration |
| Falcon Flex | Expansion and re-flex momentum | Evidence of pulled-forward demand |
| Margins | Hosting leverage continues | AI and ingestion costs rise |
| Guidance | FY27 outlook raised | High expectations unmet |