
FORT WORTH, Texas, August 19, 2026, 16:55 CDT — U.S. markets have finished trading.
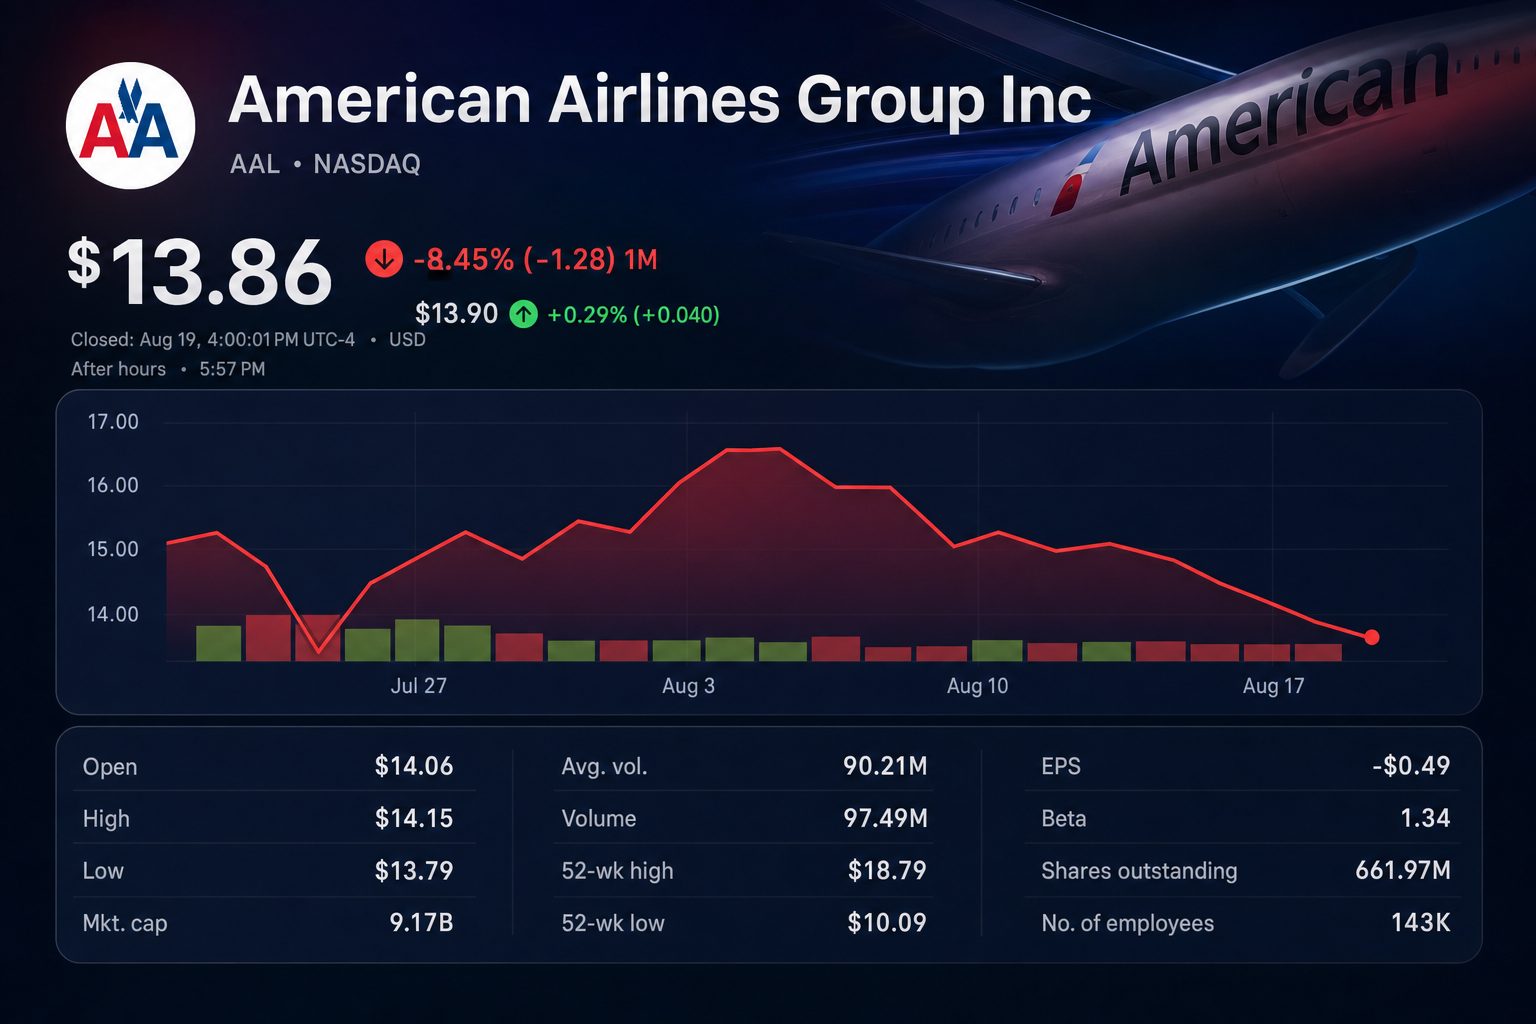
- Shares of American Airlines dropped 1.35% to $13.86 as airline stocks lost ground.
- Every consistent 10-cent change in fuel costs amounts to approximately $450 million in yearly expenses.
- Airlines are holding off on reducing fares despite a decline in jet fuel costs.
Shares of American Airlines Group Inc. NASDAQ:AAL declined 1.35% to $13.86 on Wednesday. The stock has dropped 7.2% across five sessions. Trading volume totaled 95.6 million shares, almost twice Tuesday’s level.
The upcoming airline trade in the market could depend on an atypical spread. The cost of jet fuel has dropped from about $1,900 per tonne to $1,300. Airfares are still 10% to 20% higher than they were a year ago, with airlines holding back from initiating a price war.
This mix is critical for American. As of March 31, the airline reported no fuel hedging. Its filing states that every one cent per gallon shift impacts yearly fuel costs by roughly $45 million.
| Preliminary fuel scenario | Fuel price | Change from $3.75 Q3 estimate | Impact on annual pre-tax expense | Portion of $9.18B market value |
|---|---|---|---|---|
| Company forecast | $3.75/gal | — | — | — |
| 10-cent cut | $3.65/gal | -$0.10 | +$450M | 4.9% |
| 25-cent cut | $3.50/gal | -$0.25 | +$1.13B | 12.3% |
| 50-cent cut | $3.25/gal | -$0.50 | +$2.25B | 24.5% |
The table presents the leverage. A 10-cent drop maintained over a year would amount to roughly $450 million before tax, nearly 5% of American’s present market capitalization. This is not a projection of earnings.
Timing remains a key factor. American based its third quarter projections on fuel prices around $3.75 per gallon. The company also anticipated a $1.7 billion annual increase in fuel expense. Decreased spot prices offer relief only if they last through the airline’s buying windows.
| Q2 2026 measure | Result | Year-over-year change |
|---|---|---|
| Revenue | $16.7B | +16.3% |
| GAAP net income | $71M | Not disclosed in statement |
| Adjusted net income | $99M | Not disclosed in statement |
| Fuel expense | Above $4.8B | +$2.2B / +83% |
| Managed corporate revenue | — | +26% |
| Capacity | — | +5.4% |
American posted a record $16.7 billion in revenue for the second quarter. However, GAAP profit reached just $71 million, leaving a slim margin. A $2.2 billion rise in fuel costs was nearly half absorbed by higher fares.
Chief Executive Robert Isom reported revenue growth surpassed forecasts. Premium unit revenue climbed 13.4%, and managed corporate revenue advanced 26%. The increases support fare levels.
| Airline | August 19 close | Daily move | Monday-to-Wednesday move |
|---|---|---|---|
| American Airlines NASDAQ:AAL | $13.86 | fell 1.35% | lost 4.0% |
| Delta Air Lines NYSE:DAL | $83.29 | declined 2.81% | dropped 4.9% |
| United Airlines NASDAQ:UAL | $115.78 | slipped 2.48% | fell 5.3% |
| Southwest Airlines NYSE:LUV | $41.42 | down 2.52% | off 4.5% |
On Wednesday, American surpassed the performance of its three major U.S. rivals. Delta Air Lines NYSE:DAL declined by 2.81%. United Airlines NASDAQ:UAL slipped 2.48%, and Southwest Airlines NYSE:LUV was down 2.52%.
American’s greater potential fuel benefit may be supporting this relative resilience. A lower initial valuation is also a factor. Shares are still 26% under their 52-week peak of $18.79.
| Analyst | Recommendation | Price target | Implied move from $13.86 |
|---|---|---|---|
| UBS | Buy | $18 | +29.9% |
| Goldman Sachs | Sell | $13 | -6.2% |
| BMO Capital | Hold | $19 | +37.1% |
| JPMorgan | Buy | $24 | +73.2% |
| Susquehanna | Buy | $25 | +80.4% |
Wall Street analysts offer a broad range of targets. According to StockAnalysis, 25 analysts have set an average price target of $19.03, representing a 37.3% premium over the last close. Forecasts vary from a low of $10.30 to a high of $25.
Investors will be monitoring next week to see if reduced fuel prices persist without a drop in ticket costs. If a price war emerges, passengers would gain. If fares remain steady, shareholders would retain most of the advantage.
Risks: Fuel prices can quickly move higher, while American continues without a hedge. Significant debt, high labor expenses, softer travel demand, and operational issues may offset any benefit from lower fuel costs.
The stock presents a straightforward yet volatile opportunity in fuel. What matters most is not the current oil price, but rather the gap between fuel expenses and fare revenue.
Related articles: NASDAQ:AAL
The fuel–fare spread is the trade
Illustrative annual fuel relief
$0$0.75B$1.5B$2.25B $450M$1.13B$2.25B 10¢ lower25¢ lower50¢ lower 4.9% of cap12.3% of cap24.5% of capAirlines fell together
American lost less than its three large U.S. peers, even as volume accelerated.
Published price targets
Q2 cushion was thin
$16.7B+$2.2B$71M RevenueFuel increaseGAAP profitInvestor read
The upside case is simple: jet fuel stays lower while fares hold. American's unhedged exposure then turns a modest price move into a large pre-tax benefit. The weak point is just as clear. A fare war, fuel reversal or operating disruption can consume that benefit before it reaches earnings.