

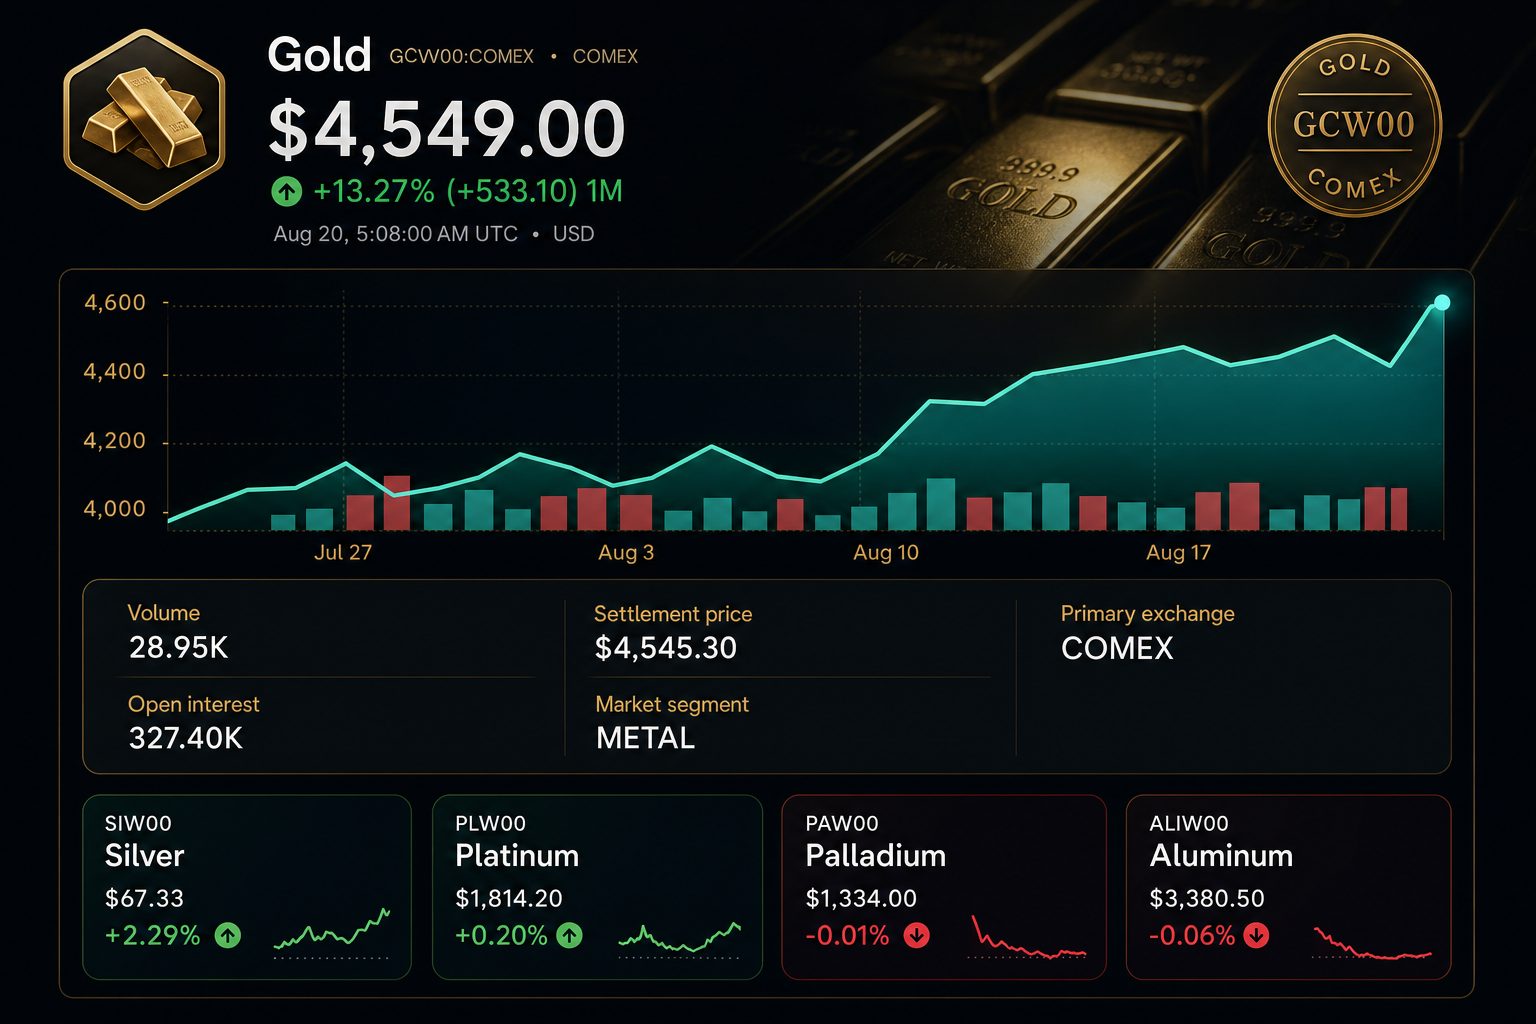
LONDON, August 20, 2026, 06:15 BST — Gold futures touched $4,500 while mining company shares climbed more than double the percentage gain seen in bullion.
- Spot gold climbed to $4,525.79 before retreating to $4,495.69 by 03:31 GMT.
- Shares of gold miners rose more than double the move seen in bullion on Wednesday.
- The breakout is now challenged by the $4,500 level and light ETF inflows.
Gold approached its highest point since early June on Thursday, as weaker Treasury yields and a dollar hovering close to three-month lows attracted buyers following Wednesday’s increase of over 4%. Spot bullion subsequently fell 0.6% to $4,495.69 per ounce as traders opted to lock in gains.
The shift is significant as publicly traded gold funds anticipated a bigger surprise. SPDR Gold Shares NYSEARCA:GLD advanced 3.3% on Wednesday. VanEck Gold Miners ETF NYSEARCA:GDX surged 9.25%, and Newmont Corporation NYSE:NEM climbed 8.5%. As a result, mining stocks outperformed gold itself by more than a twofold margin in a single day.
| Market signal | Latest verified reading | Observation time |
|---|---|---|
| Spot gold | $4,495.69, a decrease of 0.6% | Aug. 20, 03:31 GMT |
| Intraday high | $4,525.79 | Aug. 20 Asian session |
| U.S. gold futures | $4,553.30, rising 0.2% | Aug. 20, 03:31 GMT |
| U.S. dollar | Hovering just above a three-month low | Aug. 20 Asian session |
The U.S. Treasury increased its liquidity-support buybacks for longer-term bonds to twice the previous amount. Yields on the 10-year note declined by five basis points, settling at 4.65%. Yields on the 30-year bond slid by ten basis points to reach 5.19%. Declining yields lessen the opportunity cost for investors holding gold, which does not pay interest.
| Listed exposure | Wednesday change | Change versus bullion |
|---|---|---|
| Spot gold | Above 4% | 1.0x baseline |
| SPDR Gold Shares NYSEARCA:GLD | 3.3% | Direct gold backing, minus fees |
| VanEck Gold Miners ETF NYSEARCA:GDX | 9.25% | Over 2.3x |
| Newmont Corporation NYSE:NEM | 8.5% | Over 2.1x |
This leverage appeals to investors. As gold prices climb, miners’ margins can expand more rapidly than revenue. However, operating expenses and geopolitical uncertainties continue to pose risks. The same leverage effect can also work against miners if bullion loses its yield advantage.
The 200-day moving average for gold was approximately $4,504, according to Reuters. On Thursday, the metal’s peak surpassed this level by 0.5%, but the spot price later slipped to stand 0.2% lower. Gold was still 19.6% below its record of $5,595 set in January.
| Breakout test | Level | Distance from $4,495.69 spot |
|---|---|---|
| 200-day moving average | $4,504 | 0.2% higher |
| Thursday high | $4,525.79 | 0.7% higher |
| January record | $5,595 | 24.5% higher |
| Spivak support zone | $4,400-$4,500 | Spot within range |
Ilya Spivak, head of global macro at Tastylive, noted the significant rally required a period to “digest.” He said that maintaining the $4,400-to-$4,500 range would keep momentum intact. Edward Meir, analyst at Marex, commented that concerns about fiscal and financial stability were “very bullish” for gold. Reuters
The Federal Reserve acts as the counterbalance. Minutes indicated some policymakers were ready to increase rates should inflation remain stubborn. Futures reflected a 67% likelihood of rates staying unchanged in September and a 33% probability of an increase. Any fresh uptick in real yields would weigh on bullion.
Fund demand has strengthened, though no surge has been confirmed. Gold-backed ETFs saw $7 billion in inflows during the first half of August, representing around 1.2% of their $582 billion in assets. In July, net inflows stood at $3 billion, adding 23 tonnes to holdings.
| Gold ETF demand | Net flow | Holdings / AUM |
|---|---|---|
| First half, August | +$7 billion | $582 billion under management; inflow represents 1.2% |
| July | +$3 billion | 4,068 tonnes; $530 billion under management |
| First half, 2026 | +$8 billion | North America records outflow of -$7.7 billion |
SPDR Gold Shares provides investors with easy access to bullion exposure, though costs apply. The ETF has a gross expense ratio of 0.40%. Structured as a trust holding physical gold, its performance is expected to slightly lag bullion over extended timeframes.
There is still a wide range among published bank targets. J.P. Morgan holds the most optimistic view within this set. HSBC’s target sits just under Thursday’s current spot price. All of these projections were made before the recent spike in yields.
| Analyst recommendation | Published target | Implied move from $4,495.69 | Stance / date |
|---|---|---|---|
| J.P. Morgan | $6,000 average in Q4 2026 | +33.5% | Positive; June 2026 |
| UBS | $5,900 at end-2026 | +31.2% | Optimistic; Jan. 30, 2026 |
| Goldman Sachs | $5,400 at end-2026 | +20.1% | Positive; Jan. 22, 2026 |
| HSBC | $4,450 at end-2026 | -1.0% | Reserved; Jan. 8, 2026 |
Elsewhere among precious metals, silver edged up 0.2% to $67.07 on Thursday. Platinum declined 1.3% to $1,802.29, and palladium slipped 0.2% to $1,328.06. Gold’s relative strength highlights demand driven by monetary and safe-haven factors, rather than a general advance across metals.
| Precious metal | Spot price | Session move |
|---|---|---|
| Gold | $4,495.69 | declined 0.6% following Wednesday’s rally |
| Silver | $67.07 | rose 0.2% |
| Platinum | $1,802.29 | fell 1.3% |
| Palladium | $1,328.06 | edged down 0.2% |
Risks: A more aggressive Fed stance, a stronger dollar or another round of bond selling could unwind the trade. Mining stocks could fall further as their current beta has been more than double that of gold moves. Inflation stemming from oil could also challenge the argument for lower yields.
The next confirmation step is straightforward: bullion must remain above the $4,400-to-$4,500 range as ETF inflows expand. If this level fails to hold, Wednesday’s rally in mining stocks would signal a warning rather than serve as confirmation.
Related articles: NYSE:NEM






$4,500 is the decision line
U.S. ETF data: Aug. 19, 2026 · 16:00 EDT