
BOSTON, August 20, 2026, 14:25 EDT — DraftKings (DKNG.O) now offers a $150 bonus—surpassing its average monthly revenue per active payer—as the company’s promotional costs climbed 38%.
- The existing $150 bonus-bet promotion represents 114% of second-quarter monthly revenue per payer.
- Sales and marketing costs increased by 38%, as average revenue per payer declined by 13%.
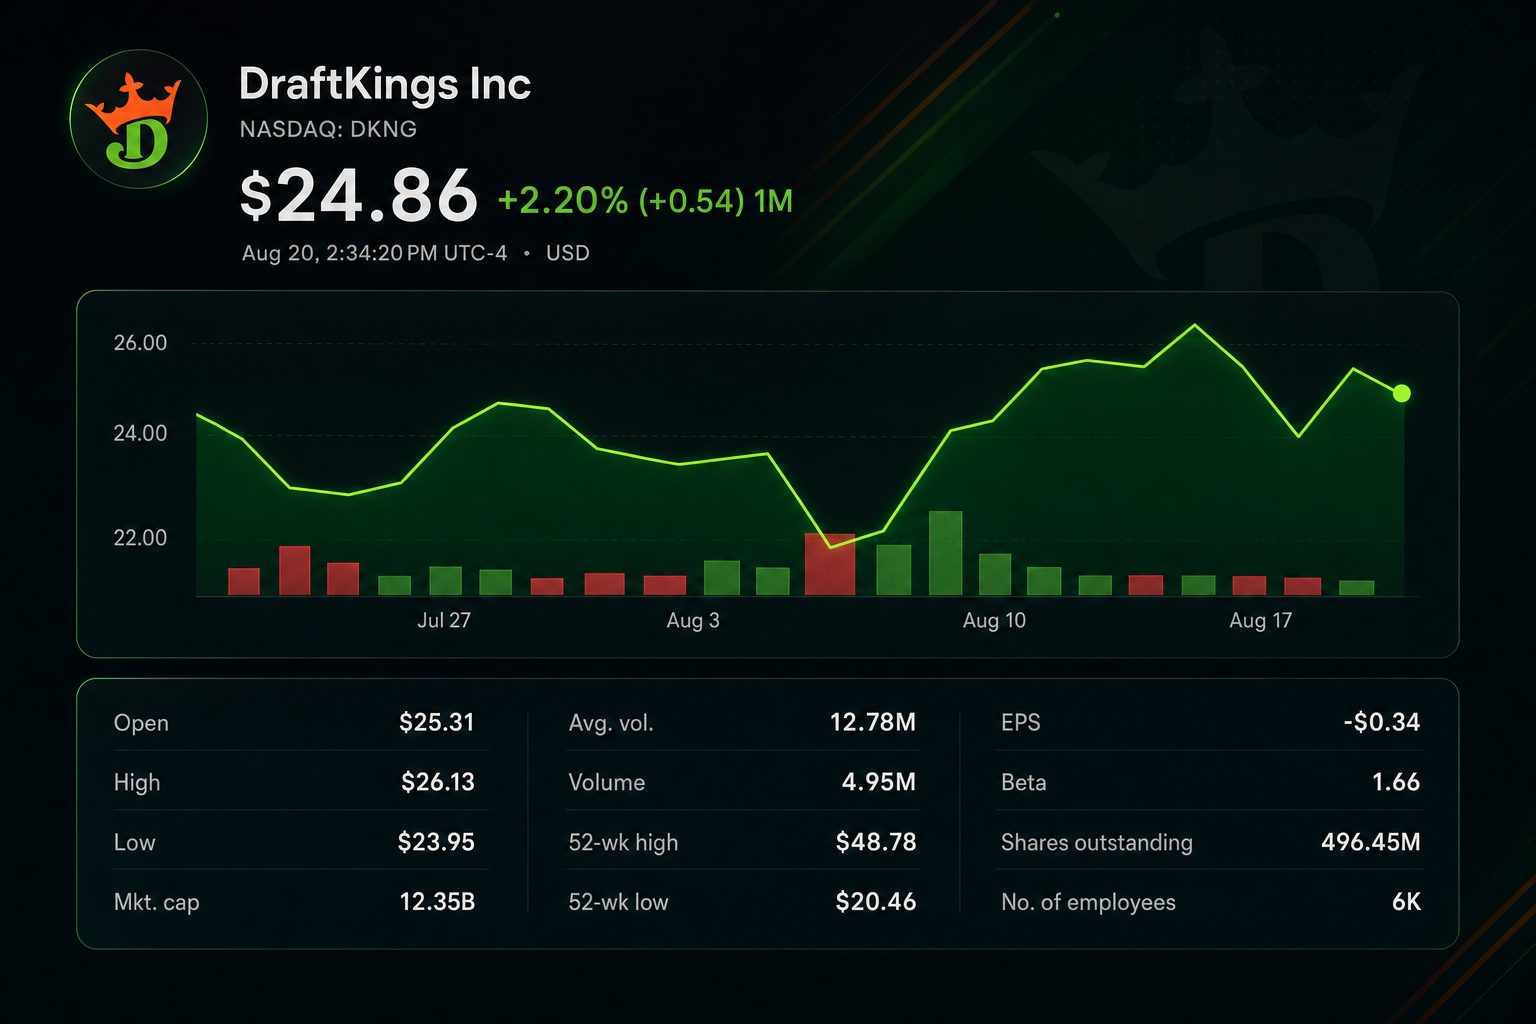
- Shares of DraftKings were down 1.4% at $24.94 during Thursday’s trading session.
DraftKings Inc. NASDAQ:DKNG is giving new users $150 in bonus bets when they place a $5 bet. The headline value of the offer is higher than the firm’s most recent monthly revenue per user.
DraftKings posted average monthly revenue per payer of $132 for the second quarter. The promoted bonus represents 114% of this amount and is equivalent to 30 times the required qualifying wager.
The comparison does not represent an accounting-cost estimate. Bonus bets come with conditions and are not the same as cash expenditures on a dollar-for-dollar basis. However, it highlights the scale of acquisition at the start of football season.
| Promotion scale | Amount | Investor read-through |
|---|---|---|
| Advertised face value of bonus bet | $150 | Customer promotion |
| Wager required to qualify | $5 | Face-value multiple of 30× |
| Q2 monthly revenue per payer (average) | $132 | Current monetization benchmark |
| Bonus face value as % of monthly revenue per payer | 114% | Demonstrative sizing only |
The approach resulted in more customers, with monthly unique payers up 9% to 3.6 million. Sports consumer volume increased 14.5% to $13.14 billion.
Monetization declined. Average revenue per payer dropped by $19, representing a decrease of roughly 13%. Quarterly revenue was down 4.6%, even as betting volume increased.
| Q2 operating measure | 2026 | 2025 | Change |
|---|---|---|---|
| Sports consumer volume | $13.14bn | $11.47bn | +14.5% |
| Monthly unique payers | 3.6m | About 3.3m | +9% |
| Average revenue per payer | $132 | $151 | -12.6% |
| Revenue | $1.443bn | $1.513bn | -4.6% |
| Sales and marketing | $322.5m | $233.2m | +38.3% |
| Adjusted EBITDA | $114.6m | $300.6m | -61.9% |
Sales and marketing expenses rose by $89.3 million, nearly 1.3 times greater than the $69.3 million drop in revenue. Softer customer outcomes also contributed to the loss, indicating that promotions were not the sole driver.
Chief Executive Jason Robins said Predictions has been “already growing faster than we anticipated.” Management noted the product, launched in December, attracts a customer base similar to Sportsbook. Company statement
DraftKings left its 2026 outlook unchanged, with the midpoint indicating an adjusted EBITDA margin of 11.9%. CFO Alan Ellingson stated that the core operations are still expected to deliver around $1 billion in adjusted EBITDA.
| 2026 forecast | Low | Midpoint | High |
|---|---|---|---|
| Revenue | $6.5bn | $6.7bn | $6.9bn |
| Adjusted EBITDA | $700m | $800m | $900m |
| Implied midpoint margin | — | 11.9% | — |
| Core business adjusted EBITDA | — | Roughly $1.0bn | — |
Investor opinion is split regarding spending priorities. At 14:17 EDT, shares of DraftKings declined 1.44% to $24.94. Flutter Entertainment plc NYSE:FLUT, which owns FanDuel, gained 0.56% to $99.80 at that time.
Analysts have adopted a more positive outlook. Data from Google Finance indicated that out of 25 analysts, 22 recommended Buy and three suggested Hold. The consensus price target stood at $33.21, reflecting a 33.1% premium over the current trading price.
| Analyst | Firm | Recommendation | Target | Date |
|---|---|---|---|---|
| Mike Hickey | Benchmark | Buy | $30.00 | Aug. 17 |
| Stephen Grambling | Morgan Stanley | Buy | $36.00 | Aug. 12 |
| Lance Vitanza | TD Cowen | Buy | $35.00 | Aug. 11 |
| James Hardiman | Citi | Buy | $32.00 | Aug. 11 |
| Greg Gibas | Northland | Hold | $28.00 | Aug. 10 |
The next assessment focuses on retention once promotional credits run out. Simply tracking sign-ups will not resolve the issue. Investors require that both average revenue per payer and adjusted EBITDA improve in tandem.
Risks: Short-term promotional impact may be outweighed by sports results. This document does not reveal offer conditions, redemption rates or customer lifetime value. Returns could also be affected by changes in regulations or heightened incentives from competitors.
Related articles: NASDAQ:DKNG
Promotions attract users. Monetization covers expenses.
August 20, 2026 · 14:17:26 EDT
Current share price
−1.44% · down $0.36
Trading volume stood at 4.68 million shares, compared with an average daily volume of 12.78 million shares at the time of the snapshot.
Present offer compared to Q2 monthly revenue per payer
A $5 qualifying bet triggers the $150 bonus. Face value does not equal cash outlay; terms, redemption and eligibility apply.
Q2 2026: acquisition rises, yield declines
| Metric | 2026 | 2025 | Change |
|---|---|---|---|
| Sports consumer volume | $13.14bn | $11.47bn | +14.5% |
| Monthly unique payers | 3.6m | ~3.3m | +9% |
| Revenue per payer | $132 | $151 | −12.6% |
| Revenue | $1.443bn | $1.513bn | −4.6% |
| Sales & marketing | $322.5m | $233.2m | +38.3% |
| Adjusted EBITDA | $114.6m | $300.6m | −61.9% |
2026 outlook bridge
Maintained range midpoints are: revenue between $6.5 billion and $6.9 billion, adjusted EBITDA from $700 million to $900 million. Management projects approximately $1 billion from the core business prior to the Predictions investment.
Summary of recommendations
Out of 25 analysts, 22 have Buy ratings and three have Hold recommendations. The average price target of $33.21 suggested a 33.1% potential rise at the time of reporting.