
NEW YORK, Aug. 22, 2026, 12:30 p.m. EDT
- Realty Income dropped 0.9% to $62.60 on Friday and edged down 0.2% over the week.
- The annualized dividend of $3.252 results in a yield of 5.20%, just 46 basis points higher than the yield on the 10-year Treasury.
- Analysts project an average price upside of 8.5%, though nine out of 15 existing ratings are Hold.
- The next significant rate test comes with U.S. inflation and GDP data due on Wednesday.
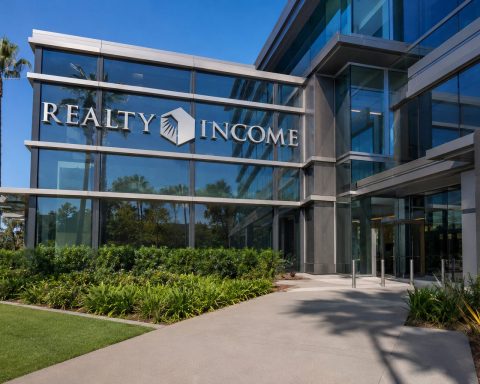
Shares of Realty Income Corporation NYSE:O fell 0.9% on Friday following an increase in the 10-year Treasury yield to 4.74%. The stock ended the session at $62.60 at 4:00 p.m. EDT, closing the week down 0.2%.
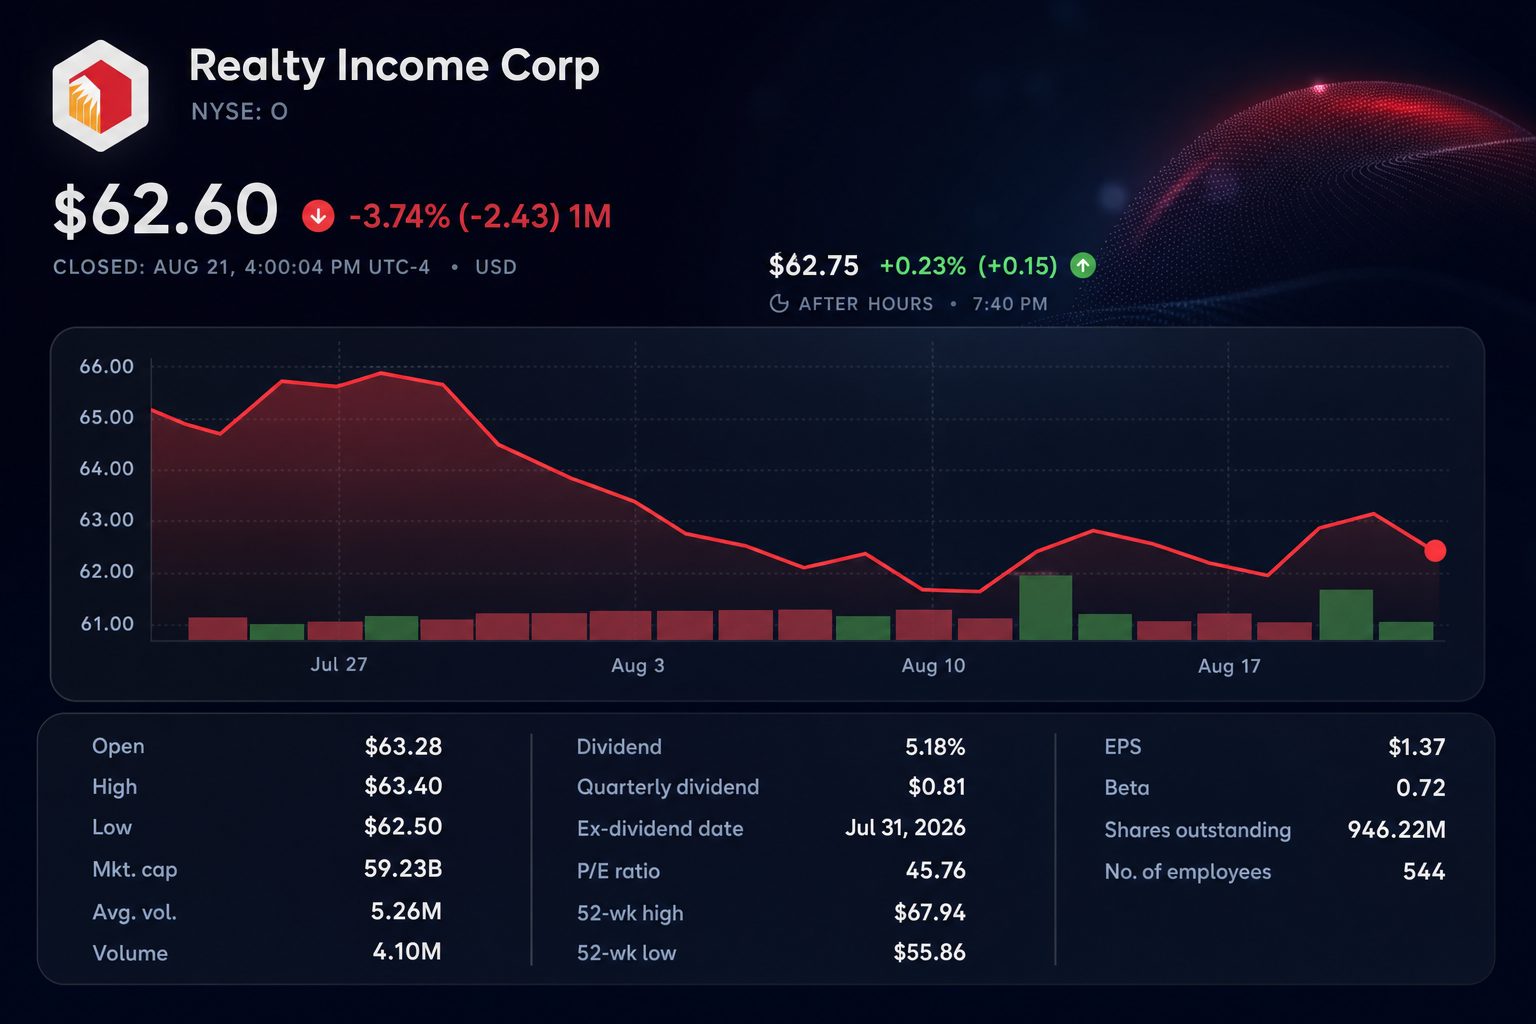
The rate change narrowed Realty Income’s yield premium. Its annualized dividend of $3.252 results in a 5.20% yield as of Friday’s market close. That provides an initial spread of roughly 46 basis points above Treasuries, compared to 50 basis points the week before.
The slim margin is at the heart of investor concerns. Realty Income delivers monthly payouts and limited growth, yet much of its reported yield now comes from government bonds. The stock could require either declining market rates or accelerated cash-flow gains to see a revaluation.
| Market measure | Aug. 14 | Aug. 21 | Change |
|---|---|---|---|
| Realty Income closing price | $62.74 | $62.60 | -0.2% |
| 10-year Treasury rate | 4.68% | 4.74% | +6 bp |
| Indicated dividend yield | 5.18% | 5.20% | +2 bp |
| Initial yield spread | 50 bp | 46 bp | -4 bp |
Trading volume on Friday reached 4.10 million shares, less than the daily average of 5.26 million. The lower activity undercuts any argument for a strong single catalyst. The stock’s fall, however, came amid rising yields, a typical headwind for income-oriented real estate stocks.
The operating base stayed stable. Adjusted funds from operations in the second quarter increased 3.8% to $1.09 per share. Occupancy held at 98.8%, and rent recapture on renewed leases was 102.7%.
| Operating measure | Q2 2026 | Comparison |
|---|---|---|
| Revenue | $1.548 billion | Up 9.7% from a year earlier |
| AFFO per share | $1.09 | Up 3.8% from a year ago |
| Portfolio occupancy | 98.8% | Was 98.6% in Q2 2025 |
| Same-store rent growth | 1.2% | Quarterly, at constant currency |
| Net debt / adjusted EBITDAre | 5.4x | As of quarter end |
Chief Executive Sumit Roy said the results demonstrated “the strength of Realty Income’s diversified platform” along with prudent capital allocation. The company increased its 2026 AFFO outlook to $4.44-$4.45 per share and raised its investment-volume forecast to $10 billion.
Access to capital provides some protection. On Aug. 14, Realty Income completed a $1 billion offering of convertible notes with a 3.75% coupon. The firm bought back roughly three million shares and kept most of the funds for debt repayment, acquisitions, and general corporate purposes.
| Capital marker | Amount | Investor relevance |
|---|---|---|
| Q2 investments | $2.6 billion | 7.3% opening cash yield |
| June 30 liquidity | $3.47 billion | Proportional allocation |
| 2026 investment guidance | $10.0 billion | Up from $9.5 billion |
| 2031 convertible notes | $1.0 billion | 3.75% interest rate |
| Annualized common dividend | $3.252 per share | 673 consecutive monthly dividend payouts |
Wall Street’s outlook is positive but measured. According to Google Finance, out of 15 analysts, five rate the stock as Buy, nine as Hold, and one as Sell. The consensus price target stands at $67.90, representing an 8.5% premium to Friday’s closing price. UBS analyst Michael Goldsmith reaffirmed his Buy rating and $72 price target on Aug. 18.
| Analyst | Firm | Rating | Target | Date |
|---|---|---|---|---|
| Michael Goldsmith | UBS | Buy | $72 | Aug. 18 |
| Brad Heffern | RBC Capital | Buy | $70 | Aug. 7 |
| Jeffrey Spector | Bank of America Securities | Hold | $72 | Aug. 7 |
| Simon Yarmak | Stifel Nicolaus | Buy | $70.75 | Aug. 6 |
| James Kammert | Evercore ISI | Hold | $67 | Aug. 6 |
The peer group highlights the trade-off. VICI Properties Inc. NYSE:VICI provides a higher yield and greater projected upside. Agree Realty Corporation (NYSE:ADC) presents a lower yield but has a higher proportion of Buy ratings. NNN REIT, Inc. (NYSE:NNN) most closely matches Realty Income in terms of yield.
| Net-lease REIT | Price | Dividend yield | Analyst mix | Average target upside |
|---|---|---|---|---|
| Realty Income NYSE:O | $62.60 | 5.18% | 5 Buy / 9 Hold / 1 Sell | 8.5% |
| VICI Properties NYSE:VICI | $26.51 | 6.79% | 8 Buy / 6 Hold | 19.0% |
| NNN REIT (NYSE:NNN) | $46.09 | 5.25% | 1 Buy / 10 Hold / 2 Sell | 4.0% |
| Agree Realty (NYSE:ADC) | $73.88 | 4.28% | 8 Buy / 2 Hold | 15.9% |
Interest rates will take center stage in the coming week. The Bureau of Economic Analysis is set to publish second-quarter GDP revisions as well as July personal income and spending data on Wednesday at 8:30 a.m. EDT. The inflation data could have a rapid impact on Treasury yields.
Wednesday brings durable-goods order figures at 8:30 a.m. EDT. New-home sales data is scheduled for Tuesday. Robust numbers may drive yields higher and weigh on O’s valuation, while softer results could enhance the attractiveness of its monthly dividend.
Risks: A shift in Treasury yields could rapidly impact spread calculations. Cash flow may be affected by tenant defaults, refinancing expenses, foreign-exchange fluctuations, and challenges in executing acquisitions. Conversion of the convertible notes has the potential to result in dilution, although capped calls provide partial mitigation.
At present, AFFO amply covers the dividend. The question of valuation is closer. Rate-driven data due Wednesday could determine if investors seek a greater yield premium.
Related articles: NYSE:O